

In Uganda, livestock production contributes approximately 4.4% to GDP at current prices, with the sector expanding at an annual growth rate of 8.8%. This trajectory aligns with Uganda’s broader transformative growth agenda, where GDP is projected to rise by 175% over the next three decades, accompanied by a tripling in consumption of livestock products (Food and Agriculture Organization of the United Nations [FAO], 2017). Livestock value chain products accounted for 7.84% and 4.93% of total national export value in 2023 and 2024, respectively, with pastoral value chain commodities, particularly live animals, dairy, meat, hides and skins, and fodder (seed and straws) contributing 61.17% and 63.78% of livestock export earnings. Household-level data further highlight the sector’s importance: 73% of Uganda’s 9.3 million households own at least one type of livestock, with the majority concentrated in the Uganda Cattle Corridor and rangeland sub-regions. These communities depend on livestock not only for food and nutritional security but also for household income, social capital (e.g., bride price and land security), and resilience against shocks. At the macroeconomic level, livestock supports local governments and the national economy through investment, trade, and associated services. Nonetheless, methodological limitations in livestock reporting, such as reliance on sample surveys prone to sampling errors, recall bias in household panel surveys, and incomplete enumeration in rangeland areas underscore the need for improved geospatial integration, participatory validation, and harmonized data systems to strengthen reliability and policy relevance (UBOS, 2024a; FAO, 2022; Nkonya et al., 2018).
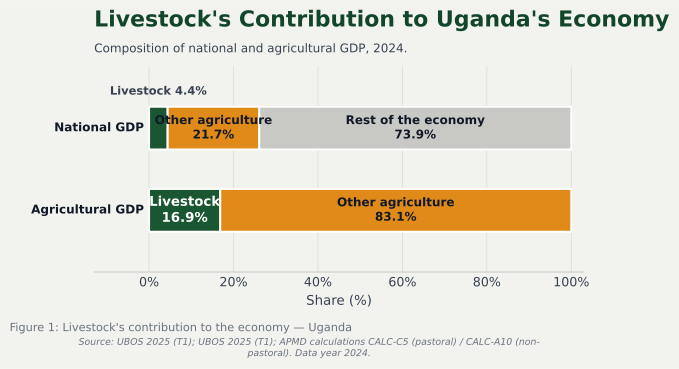
The livestock sector is a central pillar of Uganda’s economy, contributing approximately US $2.69 billion, equivalent to 4.4% of national GDP and 16.9% of agricultural GDP, with an annual growth trajectory of 8.8%. It directly supports the livelihoods of 73% of agricultural households, particularly in the cattle corridor and rangeland regions, and is prioritized under the Agro-industrialization Programme, which emphasizes dairy, beef, and animal feed & fodder. Market production statistics from UBOS national accounts show a steady increase in livestock’s economic activity at market prices, rising from UGX 3.3 trillion in 2017 to UGX 10.1 trillion in 2025, reflecting sustained growth in both subsistence and commercial systems. Export statistics compiled under the Standard International Trade Classification (SITC) framework further highlight the sector’s dynamism: live animal exports (SITC 00) grew from US $0.12 million in 1996 to US $70.5 million in 2025, meat and meat preparations (SITC 01) rose to US $8.2 million, and dairy products and bird’s eggs (SITC 02) expanded dramatically from US $0.25 million in 1996 to US $138 million in 2025. By contrast, hides and skins (SITC 21) declined from US $7.7 million in 1996 to US $0.3 million in 2025, underscoring structural challenges in quality and competitiveness. Overall, livestock-related SITC categories accounted for US $375.8 million (Inclusive of SITC08 Feeding stuff for animals $65.1 and SITC29 Crude animal & Veg. material) in 2025, US $305 million in 2024, and US $334.3 million in 2023, representing between 2.8 – 4.9% of total national exports. Despite this progress, methodological gaps persist: SITC aggregation obscures the full value of pastoral exports, while national accounts often exclude indirect benefits such as ecosystem services, informal trade, and employment multipliers, leading to systematic undervaluation of livestock’s contribution. Ongoing reforms, including improved household surveys, livestock-specific data, and integration of geospatial and participatory approaches are expected to enhance the accuracy of livestock’s representation in national accounts and strengthen evidence for policy and investment (UBOS, 2026; UBOS, 2023; UBOS, 2024a; UBOS, 2024b; UBOS, 2025a; FAO, 2022; IGAD, 2021; Nkonya et al., 2018).
| Indicator | Value | Year | Official Source |
|---|---|---|---|
| National GDP (current USD) | 60.8 billion | 2024/25 | UBOS 2025 |
| Agriculture % of GDP | 26.1 | 2024/25 | UBOS 2025 |
| Livestock % of GDP | 4.4 | 2024/25 | UBOS 2025 |
| Livestock % of Ag GDP | 16.9 | 2024/25 | UBOS 2025 |
| Livestock GDP (current USD) | 2.69 bn | 2024/25 | UBOS 2025 |
| Total Cattle Population | 14,477,878 | 2021 | UBOS 2024a |
| Total Sheep Population | 4,363,756 | 2021 | UBOS 2024a |
| Total Goat Population | 17,358,355 | 2021 | UBOS 2024a |
| Total Camel Population | 12,418 | 2021 | UBOS 2024a |
| Pastoral/Pastoralist Population | 5 million | 2022 | IWGIA, 2021 |
| Number of Pastoralists households | 1.25 million | 2024 | UBOS, 2024a |
| % of Population Pastoral | 13.7 | 2021 | UBOS 2024a; UBOS 2024c |
Uganda’s livestock production systems are highly diverse, with 72.8% of the country’s 9.3 million households owning at least one type of livestock. Pastoral households dominate cattle (24.1%), goats (34.9%), sheep (7.9%), and camel/donkey (0.2%) ownership, with average herd sizes ranging between 4–17 cattle and 5–6 small ruminants. Production is largely subsistence-oriented, with tethering systems accounting for 85.4–93.6% of households and communal grazing covering 30.6–54.5%, particularly in Karamoja where seasonal mobility and cross-border transhumance remain central. Camels and donkeys are almost entirely raised under communal systems (89.4%), reflecting the resilience of traditional pastoralism. Despite gradual transitions toward sedentary systems, adoption of fenced farms remains low (11.6–26.9%), constrained by land tenure insecurity, rising landless populations, limited capital, and poor access to extension services, inputs, and finance. The slow shift from subsistence (62.1–68.5%) to commercial production (31.5–37.9%) is being accelerated by Uganda’s 10-fold economic growth strategy under the Fourth National Development Plan (NDP IV) which is the medium term national implementation framework for Vision 2040 and Kampala CAADP Declaration (African Union, 2024; National Planning Authority, 2025; Government of Uganda, 2013), which emphasizes investment in value addition, Agro-processing, trade, and export promotion. Current trends in dairy, with exotic and crossbred cattle now comprising 23–41% of the herd (Sanchez-Molano et al., 2025), signal further commercialization, supported by public and private sector investments in feed security, animal health (including eradication of tick-borne diseases and Foot and Mouth Disease), vaccine and input production, extension services, finance, and insurance. Nonetheless, methodological limitations in livestock reporting persist: census data are derived from sample surveys prone to sampling errors and underrepresentation, while household panel and biannual agricultural surveys face recall bias and incomplete enumeration, underscoring the need for geospatial integration and participatory validation to strengthen reliability (UBOS, 2024a; FAO, 2022; Sanchez-Molano et al., 2025).

The livestock sub-sector in Uganda continues to expand. Building on the 2021 National Livestock Census, MAAIF reports cattle at 14.66 million, goats at 17.48 million, and sheep at 4.38 million in 2024 (MAAIF, 2026). Dairy stands out as the most dynamic sub-sector, undergoing a paradigm shift through genetic improvement, with exotic and crossbred cattle now comprising 23–41% of the national herd and accounting for most of the milk produced in the country. Despite these positive trends, methodological limitations remain: the census was conducted as a sample survey, which introduces sampling errors and underrepresentation in certain districts; household panel surveys and biannual agricultural surveys provide triangulation but face recall bias, incomplete enumeration, and inconsistencies in herd structures; further, reliance on conversion factors for productivity estimates often depends on expert judgment rather than direct measurement, reducing precision. These constraints underscore the need for continuous refinement of survey instruments, integration of geospatial tools, and participatory validation to improve reliability of livestock population and production data (UBOS, 2024a; FAO, 2022; Sanchez-Molano et al., 2025).
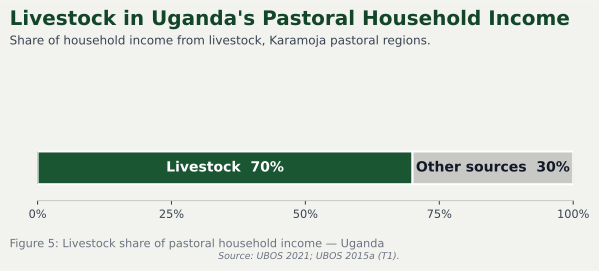
Livestock and pastoralism make a significant contribution to household incomes in Uganda, with UBOS reporting that over one-third of households are engaged in livestock farming, primarily cattle and goats, which provide both cash income through sales of milk, meat, and live animals, and non-cash benefits such as manure, draft power, and savings mechanisms (UBOS, 2024d). In pastoral regions such as Karamoja, livestock accounts for more than 70% of household earnings, underscoring its role as the backbone of local economies, while in central and western Uganda, dairy and beef value chains are more integrated into markets and contribute substantially to household cash flow and national GDP (UBOS, 2021; UBOS, 2015a). Smallholder systems dominated by indigenous cattle further enhance food security and provide supplementary income, particularly for rural households, women, and youth, while livestock also serves as a form of insurance against drought and market shocks (Opio et al., 2021). These findings highlight livestock’s critical role in household income diversification and resilience, reinforcing its importance in Uganda’s programmes: Parish Development Model, Agro-industrialization under the NDP IV and the 10-fold Economic growth strategy for fast tracking Vision 2040.
Livestock contributes significantly to employment in Uganda, engaging millions of people directly in farming and indirectly through value chain activities such as processing, marketing, and transport. UBOS data show that livestock farming is a major source of rural labor, with cattle and goat production requiring household and hired labor, while dairy cooperatives, butcheries, hides and skins processing, and feed supply chains absorb additional workers (UBOS, 2024c). The Annual Agricultural Survey 2019 reported that 74% of agricultural households raised livestock, creating consistent employment opportunities across rural areas (UBOS, 2022). FAO emphasizes that cattle systems generate jobs not only in production but also in marketing and processing, with beef identified as priority commodities in Uganda’s national development strategies (FAO, 2015a). Women and youth are particularly engaged in small-scale goat enterprises, which are accessible due to lower capital requirements and provide regular income streams (UBOS, 2015b). Regionally, pastoral systems in Karamoja sustain traditional labor structures centered on herding, while commercial dairy and beef enterprises in central and western Uganda generate formal jobs in processing plants and distribution networks (Opio et al., 2021). This evidence underscores livestock’s dual role in sustaining informal rural employment and creating formal sector opportunities, reinforcing its importance in Uganda’s socio-economic transformation.
Livestock enhances resilience by acting as a financial safety net and food security buffer, particularly in pastoral and Agro-pastoral regions where crop production is unreliable. UBOS (2024d) highlights that households engaged in livestock farming are better able to withstand droughts and price fluctuations, as animals can be sold to meet urgent cash needs or provide milk and meat during food shortages. In Karamoja and Teso, pastoralism remains the backbone of resilience, with herding systems offering mobility and flexibility to cope with erratic rainfall (UBOS, 2024d). FAO initiatives in Uganda, such as the rehabilitation of valley tanks in Katakwi and Toroma, have improved water access for up to 1,500 cattle and 1,000 small ruminants during prolonged dry spells, directly strengthening pastoralists’ adaptive capacity (FAO, 2024). The Uganda Resilient Livestock Value Chain Project led by IFAD emphasizes climate-smart practices, improved veterinary services, and feed management as pathways to reduce vulnerability and enhance household resilience to climate change and disease outbreaks (IFAD, 2024). Furthermore, sustainable livestock management practices, including rotational grazing, use of indigenous breeds, and integration of crop-livestock systems, have been identified as key strategies to build resilience while maintaining ecosystem services (UNFCCC, 2020). Overall, livestock systems in Uganda provide households with income diversification, food security, and adaptive strategies, making them indispensable for resilience in the face of climate variability and socio-economic shocks.
Livestock contributes substantially to food and nutrition security in Uganda by providing animal-sourced foods that are rich in protein and essential micronutrients, thereby improving dietary diversity and reducing malnutrition. UBOS (2024d) reports that per capita consumption of animal-sourced foods remains modest, estimated at about 8–10 kg of meat and 40–50 liters of milk annually, yet these foods supply nearly 30–35% of total dietary protein intake nationally. The National Livestock Census 2021 highlights that households owning cattle are more likely to consume milk regularly, which is associated with improved child nutrition outcomes, particularly reductions in stunting and wasting in pastoral and Agro-pastoral regions where milk is a staple food (UBOS, 2024d). FAO (2015a) emphasizes that beef value chains are critical for addressing protein gaps in Uganda’s food systems, while smallholder cattle enterprises provide affordable meat that enhances access for low-income households. Evidence from pastoral areas such as Karamoja shows that livestock ownership directly correlates with better nutrition resilience, as milk consumption among children contributes to higher dietary quality and reduces vulnerability to malnutrition (Opio et al., 2021). Overall, livestock systems are indispensable for achieving Uganda’s national food and nutrition security goals under NDP IV and the Parish Development Model, reinforcing their role in reducing malnutrition and improving dietary quality (Government of Uganda, 2021; UBOS, 2024d).
Uganda’s domestic livestock markets are diverse and regionally differentiated, with cattle and goats forming the backbone of household and commercial trade. According to the National Livestock Census 2021 by UBOS, livestock products such as milk, meat, and hides are widely marketed across districts, with central and western Uganda showing higher levels of commercialization compared to pastoral regions like Karamoja, where subsistence and informal trade dominate (UBOS, 2024). Value chains for beef, analyzed by FAO’s Livestock Production Systems Spotlight, reveal that production systems range from extensive pastoralism to semi-intensive and ranching, with stakeholders identifying beef as a priority commodity for Uganda’s Agro-industrialization agenda (FAO, 2015b). The Beef Value Chains Situation Analysis highlights that Uganda is among the top beef producers in Sub-Saharan Africa, with production estimated at 217 million kilograms in 2018, yet gaps persist between cattle reared and those slaughtered, indicating untapped potential for market expansion and value addition (Mubiru, 2018). Domestic markets are also shaped by informal trade networks, particularly in live animal sales and milk distribution, which provide critical income streams but face constraints in food safety, infrastructure, and governance. Strengthening value chains through improved feed supply, veterinary services, and cold-chain logistics is essential to enhance competitiveness, reduce post-harvest losses, and integrate smallholders into formal markets. Overall, livestock markets and value chains contribute significantly to household incomes, employment, and national GDP, but require targeted policy interventions to unlock their full potential for socio-economic transformation.
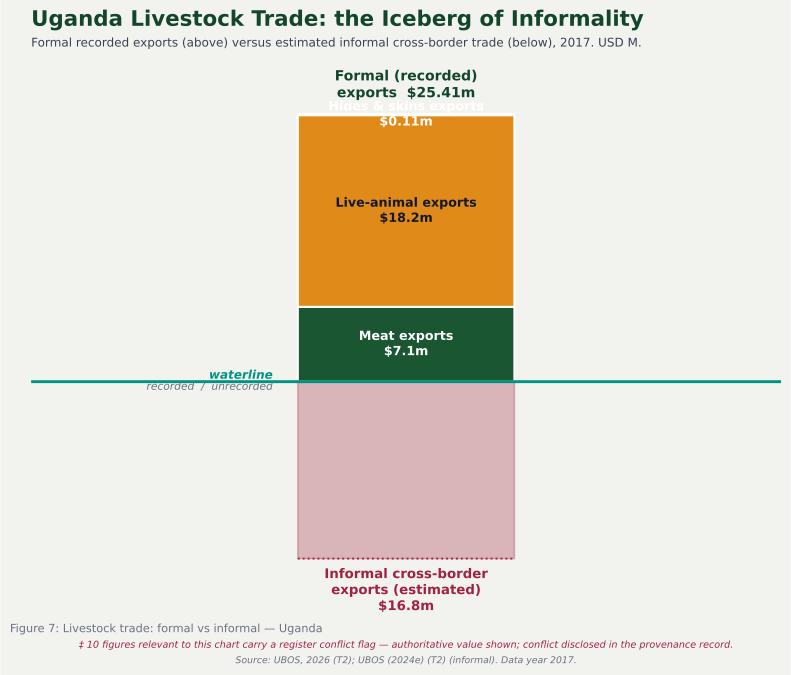

Uganda’s livestock value chain contributes significantly to cross-border and international trade, with UBOS export composition data (1996–2025) indicating that formal livestock commodity exports; mainly beef, hides and skins, dairy products, Animal feeding stuffs, Crude animal materials and live animals ranged between USD 228 and 376 million annually (2016–2025). Imports, though smaller, include Feeding stuffs for animals, Live animals, dairy and dairy products, and crude animal materials to supplement domestic supply. Yet, evidence from FAO and ILRI shows that informal cross-border flows are two to three times higher than formal records, particularly in Karamoja and West Nile, where live cattle and goats move into South Sudan, Kenya, and the Democratic Republic of Congo through porous borders (FAO, 2015b; Mubiru, 2018). Key trade corridors include Busia and Malaba into Kenya, Elegu into South Sudan, and Arua into DRC, with Kenya and Rwanda serving as major formal trading partners for beef and dairy, while South Sudan remains the largest destination for live cattle and goats. The gap between formal exports captured in UBOS tables and actual trade volumes underscores the importance of recognizing informal trade networks, harmonizing standards, and improving border infrastructure to fully capture livestock’s role in Uganda’s trade and economic transformation. The percentage contribution to sector value chain exports including feeding stuff for animals is presented in Figure 4 below.
| Trade Flow | Value (USD M) | Year | Formality | Key Partners | Source |
|---|---|---|---|---|---|
| Live Animal Exports | 70.48 | 2025 | Formal | Central African Republic, the Republic of Côte d'Ivoire, the Democratic Republic of Congo, the Republic of Burundi, the Republic of Kenya, the Republic of Rwanda, the Republic of South Sudan, and the United Republic of Tanzania | UBOS (2026) |
| Meat Exports | 8.22 | 2025 | Formal | Democratic Republic of the Congo, the Republic of Rwanda, the Republic of South Sudan, the United Arab Emirates, the Kingdom of Saudi Arabia, the People’s Republic of China, the Hong Kong Special Administrative Region of the People’s Republic of China, the Sultanate of Oman, the Socialist Republic of Viet Nam, the Republic of Burundi, the United Republic of Tanzania, the Arab Republic of Egypt, the Kingdom of Bahrain, Kingdom of Cambodia, the Kingdom of Norway, and the Republic of Kenya. | UBOS (2026) |
| Dairy products and bird's eggs | 137.95 | 2025 | Formal | Democratic Republic of the Congo, Kenya, South Sudan, Rwanda, Somalia, India, Bahrain, Egypt, Japan, Malawi, Netherlands, Oman, Seychelles, Tanzania, United States of America, Burundi, Canada, United Arab Emirate | UBOS (2026) |
| Hides/Skins Exports | 8.56 | 2024 | Formal | Malaysia, the Islamic Republic of Pakistan, the People’s Republic of China, the Hellenic Republic (Greece), the Republic of India, the Republic of Indonesia, the Italian Republic, the United Kingdom of Great Britain and Northern Ireland, the Republic of Kenya, the Republic of Ghana, the Federal Republic of Nigeria, the Democratic Republic of the Congo, the Democratic Socialist Republic of Sri Lanka, the Kingdom of Thailand, the Republic of Turkey, and the United Arab Emirates. | UBOS (2026) |
| Informal Cross-Border Exports | 16.811 | 2023 | Informal | Democratic Republic of the Congo, Republic of Kenya, Republic of South Sudan, Republic of Burundi, Republic of Rwanda | UBOS (2024e) |
| Live Animal Imports | 19.1 | 2025 | Formal | Kenya, Turkey, Rwanda, South Africa, United Kingdom, South Sudan, France, Tanzania, Belgium, Brazil, Egypt, Ethiopia, Germany, Hungary, India, Netherlands, Nigeria, Spain, Zambia, Austria, China | UBOS (2026) |
| Meat Imports | 6.88 | 2025 | Formal | China, Belgium, Kenya, Seychelles, Thailand, United Arab Emirate, South Africa, South Sudan, Spain, Poland, Canada, Italy, United States of America, France, Democratic Republic of Congo | UBOS (2026) |
| Dairy products and bird's eggs | 32.1 | 2025 | Formal | Argentina, Austria, Bahrain, Belgium, Brazil, Belarus, China, the Democratic Republic of the Congo, Denmark, Egypt, Finland, France, Germany, Ghana, Greece, India, the Islamic Republic of Iran, Indonesia, Italy, Japan, Kenya, Malaysia, Namibia, the Netherlands, New Zealand, Niger, Norway, Oman, Poland, Rwanda, Saudi Arabia, Sierra Leone, Singapore, South Africa, South Sudan, Sweden, Switzerland, Tanzania, Thailand, Turkey, the United Arab Emirates, the United Kingdom of Great Britain and Northern Ireland, the United States of America, Uruguay, and Viet Nam | UBOS (2026) |
| USD 16.8 million is the recorded value from the Informal Cross Border Trade (ICBT) survey (UBOS, 2024e); the true informal trade value is believed to be substantially higher but is not precisely quantified. | |||||
Market integration in livestock trade shapes socio-economic outcomes by expanding pastoral communities’ access to regional and international markets, thereby improving household incomes, livelihood security, and resilience. Evidence from Uganda’s Informal Cross Border Trade Survey Report 2024 shows that informal livestock exports to South Sudan, Kenya, and the Democratic Republic of the Congo provide critical income streams for pastoral households, yet remain under-recognized in official statistics, limiting their visibility in national accounts (UBOS, 2024e). Integration reduces transaction costs and stabilizes food supplies, but barriers such as inadequate infrastructure, restrictive border policies, and limited veterinary oversight constrain equitable participation (UBOS, 2024e). Price dynamics further influence welfare, with favorable regional demand boosting incomes, while volatility exposes households to shocks that undermine food security and resilience. Recent analyses highlight that well-managed market integration not only strengthens value chains but also embeds pastoral systems into broader socio-economic transformation agendas, linking trade flows to poverty reduction and regional stability (International Livestock Research Institute [ILRI], 2023; International Fund for Agricultural Development, 2024).
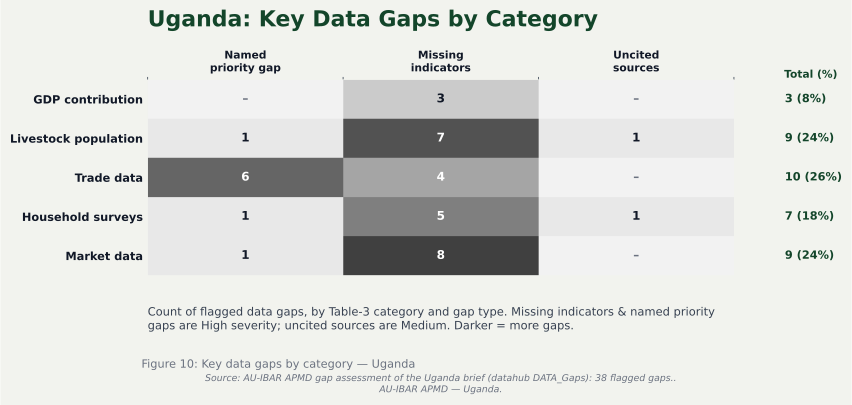
Despite the progress in livestock statistics, Uganda’s data systems continue to face critical methodological gaps that constrain the full recognition of pastoral contributions. SITC aggregation obscures the actual value of pastoral exports, while national accounts often exclude indirect benefits such as ecosystem services, informal trade, and employment multipliers, leading to systematic undervaluation of livestock’s role (UBOS, 2023; UBOS, 2024a; UBOS, 2024b; UBOS, 2025a; FAO, 2022; IGAD, 2021; Nkonya et al., 2018). Household panel surveys and biannual agricultural surveys remain prone to recall bias and incomplete enumeration, particularly in rangeland districts, while sample-based livestock censuses introduce sampling errors and underrepresentation of pastoral households (UBOS, 2024a). Informal cross-border trade flows, estimated to be two to three times higher than formal records, are inadequately captured due to limited border coverage and unrecorded night-time transactions (UBOS, 2024e). Productivity estimates often rely on conversion factors and expert judgment rather than direct measurement, reducing precision in feed balances and livestock output statistics (Sanchez-Molano et al., 2025). These gaps matter because they distort the evidence base for policy and investment, particularly in pastoral regions where informal trade and ecosystem services are central to livelihoods. Addressing them requires reforms such as livestock-specific survey modules, integration of geospatial mapping, participatory validation, and harmonized data systems to strengthen reliability and policy relevance.
| Data Category | Gap Description | Impact on Recognition | Possible Action |
|---|---|---|---|
| GDP Contribution | SITC aggregation and national accounts exclude indirect benefits (ecosystem services, informal trade, employment multipliers) (UBOS, 2023; UBOS, 2024a; FAO, 2022). | Systematic undervaluation of livestock’s contribution to GDP and agricultural GDP. | Integrate ecosystem service valuation, expand livestock-specific accounts, harmonize with Agro-industrialization frameworks. |
| Livestock Population | Census data derived from sample surveys prone to sampling errors, recall bias, and incomplete enumeration in rangeland districts (UBOS, 2024a; Sanchez-Molano et al., 2025). | Underrepresentation of mobile pastoralists and distortions in herd structures and productivity estimates. | Improve survey instruments, integrate geospatial mapping, and adopt participatory validation approaches. |
| Trade Data | Formal trade statistics underreport actual flows; informal cross-border trade estimated to be 2–3 times higher than official records (UBOS, 2024e; Mubiru, 2018). | Livestock’s role in regional trade and household income is underestimated, limiting visibility in policy and investment. | Expand Informal Cross Border Trade (ICBT) survey coverage, include night-time transactions, harmonize regional monitoring systems. |
| Household Surveys | Household panel surveys face recall bias and limited livestock-specific modules (UBOS, 2015b; UBOS, 2022). | Weak evidence on household-level contributions to income, nutrition, and resilience. | Introduce livestock-specific modules in national surveys, triangulate with agricultural census, and strengthen district-level disaggregation. |
| Market Data | Limited data on value chain performance, post-harvest losses, and informal market networks (FAO, 2015b; Mubiru, 2018). | Incomplete understanding of market integration, competitiveness, and smallholder participation. | Develop livestock market observatories, improve cold-chain and infrastructure data, and incorporate informal market mapping. |
Summary of findings
Livestock is a central pillar of Uganda’s economy, contributing 4.4% of national GDP and 16.9% of agricultural GDP, equivalent to USD 2.69 billion in 2024/25. The sector supports 73% of agricultural households, particularly in the cattle corridor and rangeland regions, and is expanding at an annual growth rate of 8.8%. Export data show strong growth in dairy and live animal trade, with formal livestock exports ranging between USD 228 and 376 million annually (2016–2025; UBOS, 2026). However, informal cross-border flows especially to South Sudan, Kenya, and the Democratic Republic of Congo are estimated to be two to three times higher than official records, underscoring the sector’s under-recognized role in regional trade.
At the household level, livestock provides critical income, food, and resilience. In pastoral sub regions such as Karamoja, livestock accounts for more than 70% of household earnings, while milk and eggs are linked to reductions in child stunting and wasting. Employment opportunities span production, processing, and marketing, with women and youth particularly engaged in goat enterprises. Despite these contributions, methodological gaps persist for instance, census data face sampling errors and recall bias, SITC aggregation obscures pastoral exports, and ecosystem services and informal trade remain excluded from national accounts. These limitations systematically undervalue livestock’s socio-economic role.
Policy Implications
-
1Establish Livestock-Specific Satellite Accounts: National policymakers should integrate ecosystem service valuation, informal trade flows, and employment multipliers into GDP accounting to capture the full economic weight of livestock (UBOS, 2025a; FAO, 2022).
-
2Strengthen Informal Trade Monitoring: Regional bodies such as IGAD should harmonize cross-border trade monitoring systems and expand Uganda’s Informal Cross Border Trade (ICBT) surveys to include night-time transactions and unmonitored border points, ensuring accurate recognition of pastoral trade flows (UBOS, 2024e; Mubiru, 2018).
-
3Invest in Inclusive Value Chains: Government should prioritize infrastructure for cold-chain logistics, veterinary oversight, and feed & fodder supply, while providing targeted financing for women and youth in goat enterprises to enhance competitiveness and employment (UBOS, 2022; FAO, 2015b).
-
4Scale Up Climate-Smart Livestock Practices: National and regional programs should expand investments in water infrastructure (e.g., valley tanks), rotational grazing, and indigenous breed conservation to strengthen resilience against drought and climate shocks (FAO, 2024; IFAD, 2024).
-
5Improve Data Systems and Geospatial Integration: UBOS and MAAIF should operationalize the National Livestock Statistics Framework by refining survey instruments, integrating geospatial tools, strengthening Integrated Multisectoral Information management systems and adopting participatory validation to reduce sampling errors and improve district-level disaggregation (UBOS, 2024a; Sanchez-Molano et al., 2025).
- Food and Agriculture Organization of the United Nations. (FAO) (2015a). Livestock and Livelihoods Spotlight: Uganda – Cattle and Poultry Sectors. Rome: FAO.
- Food and Agriculture Organization of the United Nations. (2015b). ASL2050 Livestock Production Systems Spotlight: Uganda – Beef and Chicken Meat. Rome: FAO.
- Food and Agriculture Organization of the United Nations. (2017). The future of food and agriculture: Trends and challenges (I7503EN/1/06.17). Rome: FAO. © FAO.
- Food and Agriculture Organization of the United Nations. (2022). Annual Agricultural Survey Uganda 2020. Rome: FAO.
- Food and Agriculture Organization. (2024). Building Resilience in Cropping, Poultry, and Pastoralism in Uganda. Rome: FAO.
- Intergovernmental Authority on Development (IGAD). (2021). Livestock Sector Contribution to National Accounts in IGAD Member States. Djibouti: IGAD Secretariat.
- International Fund for Agricultural Development (IFAD). (2024). Uganda Resilient Livestock Value Chain Project: Project Design Report. Rome: IFAD.
- International Livestock Research Institute. (2023). Beef value chain situation analysis for Uganda. Nairobi: ILRI.
- Mubiru, S. L. (2018). Beef Value Chains Situation Analysis for Uganda. International Livestock Research Institute (ILRI).
- Nkonya, E., Pender, J., & Kato, E. (2018). Contribution of Livestock to Uganda’s Economy. International Livestock Research Institute (ILRI) Working Paper. Nairobi: ILRI.
- Opio, P., Mayanja, S., & Tumusiime, D. (2021). Resilience of pastoral communities to climate shocks in Karamoja. Pastoralism: Research, Policy and Practice.
- Sanchez-Molano, E., Mukiibi, R., Riggio, V., Ogwang, J., Kawule, L., & Benda, K. B. (2025). Genomic and health characteristics of crossbred dairy cattle in central Uganda. Frontiers in Genetics, 16, 1567910. https://doi.org/10.3389/fgene.2025.1567910
- Uganda Bureau of Statistics. (UBOS). (2015). Uganda National Panel Survey 2013/14: Livestock and Livelihoods Spotlight. Kampala: UBOS.
- Uganda Bureau of Statistics. (2023). Statistical Abstract 2023. Kampala: UBOS.
- Uganda Bureau of Statistics. (2024a). National Livestock Census 2021 Report. Kampala: UBOS.
- Uganda Bureau of Statistics. (2024b). Statistical Abstract 2024. Kampala: UBOS.
- Uganda Bureau of Statistics. (2024d). Agriculture Transforms Livelihoods in Uganda. Kampala: UBOS.
- Uganda Bureau of Statistics. (2024c). The National Population and Housing Census 2024 – Final Report - Volume 1 (Main), Kampala, Uganda.
- Uganda Bureau of Statistics. (2024e). Informal Cross Border Trade Survey Report 2023. Kampala: UBOS.
- Uganda Bureau of Statistics. (2025a). Revised Estimates of Gross Domestic Product, FY 2024/25. Kampala: UBOS.
- Uganda Bureau of Statistics. (2025b). Statistical Abstract 2025. Kampala: UBOS.
- Uganda Bureau of Statistics. (2025c). Annual Gross Domestic Product Publication Tables June 2024-25: in National Accounts – Publications and articles. Kampala: UBOS. https://www.ubos.org/explore-statistics/9/
- Uganda Bureau of Statistics. (2026). Excel tables for Composition of Exports and Imports from 1996 to 2025: in External trade – Publications and articles. Kampala: UBOS. https://www.ubos.org/explore-statistics/10/
- United Nations Framework Convention on Climate Change (UNFCCC). (2020). Improving Livestock Management Systems Including Agropastoral Production: Uganda Case Study. Bonn: UNFCCC.
- African Union. (2024). Kampala CAADP Declaration: Advancing agricultural transformation and food security in Africa. Kampala, Uganda: African Union Commission.
- National Planning Authority. (2025). Fourth National Development Plan (NDP IV) 2025/26–2029/30. Government of Uganda. Retrieved from https://www.npa.go.ug/ndp-iv-2025-26-2029-30/
- Ministry of Agriculture, Animal Industry and Fisheries (MAAIF). (2026). Statistical Abstract 2026. Kampala: MAAIF. (Table 17: Livestock Population by type from 2020–2024.)
- National Planning Authority (NPA-Government of Uganda). (2013). Uganda Vision 2040. Kampala: National Planning Authority. Retrieved from https://www.npa.go.ug/uganda-vision-2040/.
- Government of Uganda. (2021). Parish Development Model: Transforming subsistence households into the money economy. Kampala: Ministry of Finance, Planning and Economic Development.
| Description | Fiscal Year | ||||||||
|---|---|---|---|---|---|---|---|---|---|
| 2016/17 | 2017/18 | 2018/19 | 2019/20 | 2020/21 | 2021/22 | 2022/23 | 2023/24 | 2024/25 | |
| Percentage (%) | 3.0 | 3.2 | 3.4 | 3.8 | 3.9 | 4.0 | 4.1 | 4.2 | 4.4 |
| Current prices (billion UGX) | 3,309 | 3,876 | 4,490 | 5,268 | 5,835 | 6,456 | 7,430 | 8,522 | 10,073 |
| Current prices (billion USD) | 0.88 | 1.03 | 1.20 | 1.40 | 1.56 | 1.72 | 1.98 | 2.27 | 2.69 |
| Source: UBOS, 2025c | |||||||||
| Livestock Type | Year | |||
|---|---|---|---|---|
| 2021* | 2022 | 2023 | 2024 | |
| Cattle | 14.5 | 14.53 | 14.61 | 14.66 |
| Goats | 17.36 | 17.41 | 17.44 | 17.48 |
| Sheep | 4.36 | 4.37 | 4.37 | 4.38 |
| Source: MAAIF, Statistical Abstract 2026 (Table 17); 2021* = data reported from the National Livestock Census. 2022–2024 are MAAIF-reported census-anchored updates. | ||||
| Description | 2016 | 2017 | 2018 | 2019 | 2020 | 2021 | 2022 | 2023 | 2024 | 2025 |
|---|---|---|---|---|---|---|---|---|---|---|
| Live animals other than animals of division 03 | 9.7 | 18.2 | 25.2 | 39.8 | 19.7 | 32.8 | 32.1 | 42.6 | 44.3 | 70.5 |
| Meat and meat preparations | 2.3 | 7.1 | 7.6 | 3.0 | 2.4 | 3.4 | 4.3 | 4.6 | 6.5 | 8.2 |
| Dairy products and bird's eggs | 62.8 | 85.0 | 86.7 | 78.7 | 79.5 | 100.6 | 124.6 | 113.5 | 103.6 | 137.9 |
| Feeding stuff for animals (not including unmilled cereals) | 29.9 | 81.4 | 87.2 | 35.7 | 51.9 | 42.5 | 57.1 | 88.1 | 63.6 | 65.1 |
| Hides, skins and furskins, raw | 0.05 | 0.14 | 0.07 | 0.03 | 0.12 | 0.32 | 0.11 | 0.60 | 0.26 | 0.28 |
| Crude animal and vegetable materials, nes | 54.7 | 61.9 | 67.3 | 61.2 | 59.9 | 75.6 | 67.5 | 73.0 | 75.1 | 73.6 |
| Animal oils and fats | 0.000 | 0.002 | 0.003 | 0.007 | 0.039 | 0.031 | 0.074 | 0.044 | 0.027 | 0.033 |
| Anim. or veget. fats and oils, processed; animal or vegetable waxes | 17.5 | 18.9 | 15.3 | 8.4 | 13.3 | 23.6 | 9.9 | 1.9 | 3.1 | 10.1 |
| Leather, leather manufactures, nes, and dressed furskins | 51.4 | 53.1 | 46.2 | 21.3 | 8.8 | 13.7 | 13.1 | 10.0 | 8.5 | 10.0 |
| Total | 228.5 | 325.8 | 335.6 | 248.2 | 235.5 | 292.6 | 308.8 | 334.3 | 305.0 | 375.8 |
| Source: UBOS, 2026 | ||||||||||