

Nigeria is Africa’s most populous country, with an estimated population exceeding 240 million people in 2025. The country spans diverse agro-ecological zones, from the Sahel and Sudan savannah in the north to the humid forest and coastal systems in the south, shaping livestock production and distribution patterns.
Agriculture contributed approximately 23.16% of national GDP (NBS GDP Report Q1 2026), with the sector remaining the primary livelihood source for a large proportion of rural households. Livestock alone accounted for 3.1% of national GDP and 13.2% of agricultural GDP, with an estimated livestock value-added of NGN 1.57 trillion (NBS GDP Report Q1 2026).
Nigeria possesses one of the largest livestock populations in its region, comprising approximately: 54.81 million cattle; 138.95 million goats; and 64.93 million sheep (NASS, 2023).
The sector supports an estimated 20 million pastoral and agro-pastoral people and contributes significantly to: household income; employment; food and nutrition security; trade; transport; savings; and household resilience.
Livestock production systems include:
- pastoral;
- agro-pastoral;
- mixed crop-livestock;
- and intensive peri-urban/commercial systems.
Despite its economic importance, the sector remains partly underrepresented in national statistics due to limited data on: informal livestock trade; pastoral mobility; household consumption; cross-border flows; and non-market livestock functions.

The livestock sector constitutes a major component of Nigeria’s agricultural economy. According to the National Bureau of Statistics (NBS), agriculture contributed approximately 23.16% to national GDP (NBS GDP Report Q1 2026), while livestock alone accounted for approximately 3.1% of total GDP and about 13.2% of agricultural GDP. Based on these estimates, the livestock sector generated an estimated NGN 1.57 trillion in value-added in the first quarter of 2026 (NBS GDP Report Q1 2026).
These figures underscore the strategic importance of livestock within Nigeria’s food systems, rural economy, and agricultural transformation agenda. Livestock production supports millions of households directly and indirectly through production, marketing, transport, processing, veterinary services, feed supply, and retail activities.
However, the current estimates likely understate the full economic contribution of the sector. Several methodological limitations continue to affect livestock sector accounting in Nigeria, particularly:
- limited integration of pastoral systems into national economic statistics;
- weak capture of informal and cross-border livestock trade;
- inadequate valuation of non-market livestock functions such as savings, insurance, manure, and traction;
- limited measurement of livestock-derived value chains including hides, skins, and informal processing activities;
- and insufficient disaggregation of livestock-related activities within national accounts.
Historically, livestock population estimation in Nigeria relied heavily on projection-based methodologies anchored on the 1992 Resource Inventory and Management Limited (RIMS) livestock survey benchmark. Subsequent annual estimates generated through the National Agricultural Extension and Research Liaison Services Agricultural Performance Survey (APS) primarily utilised annual growth assumptions derived from the RIMS framework. While useful for trend monitoring, these methods had important limitations in capturing evolving livestock dynamics, particularly under conditions of climate change, conflict, market transformation, and pastoral mobility.
The implementation of the National Bureau of Statistics (NBS) National Agricultural Sample Census (NASC) fielded in 2022, released in 2023 represented the first large-scale updated livestock population assessment in over three decades. It was followed by the National Agricultural Sample Survey (NASS) 2023, conducted jointly by NBS, the Federal Ministry of Agriculture and Food Security, FAO, and the World Bank, and officially released in October 2025. NBS describes NASS as its most comprehensive assessment of national agricultural output; this brief therefore adopts NASS 2023 as the primary source for national livestock population figures, while retaining NASC 2023 for sub-national/state-level detail livestock-socioeconomic variables not covered in the public NASS release.
| Indicator | Value | Year | Official Source |
|---|---|---|---|
| National GDP (current USD) | 307.50 billion | 2025 | NBS GDP Report |
| Agriculture % of GDP | 23.16% | 2025 | NBS GDP Report |
| Livestock % of GDP | 3.1% | 2025 | NBS GDP Report |
| Livestock % of Ag GDP | 13.2%* | 2025 | NBS GDP Report Q1 2026 |
| Livestock value-added (real) | NGN 1.57 trillion | 2025 | NBS GDP Report Q1 2026 |
| Total Cattle Population | 54,810,000 | 2023 | NASS/NBS |
| Total Sheep Population | 64,930,000 | 2023 | NASS/NBS |
| Total Goat Population | 138,950,000 | 2023 | NASS/NBS |
| Total Camel Population | 272,866 | 2023 | NASS/NBS |
| Pastoral/Pastoralist Population | ~20 million | 2023 | NBS/NASC and literature synthesis |
| % of Population Pastoral | 8.25% | 2023 | Derived estimate from NBS data and NPC Census |
Note on derivation and adoption: This brief adopts NASS 2023 (National Agricultural Sample Survey, released October 2025) as the primary source for national livestock population totals, as NBS designates it the country's most comprehensive current agricultural dataset. Cattle, goat and sheep totals throughout this brief, including the national totals in Table 1 and the state-level figures in Table 21, are drawn from NASS 2023. Where NASC- and NASS-sourced figures appear in the same table or paragraph, the source column indicates which applies. Livestock's share of agricultural GDP (13.2%) is derived independently from the NBS GDP Report (2025): 3.1% ÷ 23.16%.
Nigeria’s livestock sector is characterised by diverse production systems shaped by ecological conditions, market access, livelihood strategies, and cultural practices. The major livestock production systems include pastoral, agro-pastoral, mixed crop-livestock, and intensive/peri-urban systems. These systems differ in herd management, mobility patterns, input use, market orientation, and geographic concentration.
| Production System | Characteristics | Estimated Share |
|---|---|---|
| Pastoral system | Mobile/transhumant cattle production in arid and semi-arid zones | 35–40% |
| Agro-pastoral system | Mixed crop-livestock production with seasonal mobility | 30–35% |
| Mixed crop-livestock system | Sedentary smallholder livestock integrated with cropping | 20–25% |
| Intensive/peri-urban system | Commercial dairy and feedlot systems | 5–10% |
Pastoral systems constitute the dominant management system for ruminant livestock production in Nigeria, particularly cattle, sheep, goats, camels, and donkeys. These systems are concentrated mainly within the semi-arid and savannah zones of northern Nigeria, especially the North West, North East, and parts of the North Central region.
Pastoral production is largely extensive and mobility-based, relying on seasonal movement in search of pasture and water resources. Herds are typically managed under communal grazing arrangements and transhumance routes.
The principal pastoral groups include:
- Fulani (Fulbe) pastoralists;
- Shuwa Arab pastoralists;
- Koyam and Manga pastoral communities in the North East;
- Tuareg-linked transhumant groups
- and other transhumant agro-pastoral households.
The Fulani remain the dominant pastoral population nationally and account for the majority of mobile cattle production systems.
Evidence from historical Resource Inventory and Management Limited RIMS surveys, APS estimates, and subsequent livestock studies suggests that approximately:
- 70–80% of national cattle populations are managed under extensive pastoral and agro-pastoral systems;
- while pastoralists account for approximately 90–95% of local milk production in Nigeria.
The concentration of cattle populations in the northern zones strongly reflects the dominance of pastoral systems. According to the 2023 National Bureau of Statistics National Agricultural Sample Census (NASC), the North West and North East zones jointly account for the majority of Nigeria’s cattle population.
Pastoral systems also dominate camel and donkey production, particularly within:
- Sokoto,
- Kebbi,
- Katsina,
- Jigawa,
- Yobe,
- and Borno States.
Agro-pastoral systems combine livestock rearing with crop cultivation and represent a transitional system between fully mobile pastoralism and sedentary farming systems. These systems are widespread across:
- North Central Nigeria;
- southern parts of the North West and North East;
- and increasingly within grazing reserve settlements.
Under agro-pastoral systems:
- livestock graze on natural pastures and crop residues;
- households cultivate cereals, legumes, and root crops;
- manure and animal traction support crop production;
- and livestock serve both subsistence and commercial functions.
Studies from grazing reserve settlements indicate increasing integration of crop and livestock production due to declining grazing land, insecurity, and settlement pressures.
Agro-pastoral systems are estimated to manage approximately:
- 15–25% of national cattle populations;
- And substantial proportions of sheep and goats.
These systems are particularly important for livelihood diversification and resilience among semi-settled pastoral households.
Mixed crop-livestock systems are widespread among smallholder farming households across both northern and southern Nigeria. These systems involve the integration of livestock with crop farming activities and are typically sedentary.
Livestock commonly managed under these systems include:
- goats,
- sheep,
- and small cattle herds.
Crop residues serve as important livestock feed resources, while manure contributes to soil fertility and crop productivity. Livestock also function as household savings, insurance, and draft power assets.
Mixed systems are especially prominent in:
- North Central Nigeria;
- southern Guinea savannah zones;
- and peri-urban farming areas.
The NASC 2023 livestock distribution data indicate strong integration of small ruminants within mixed farming systems nationwide.
Intensive and peri-urban livestock systems are increasingly important in southern Nigeria and around major urban centres such as:
- Lagos,
- Ibadan,
- Kano,
- Port Harcourt,
- Kaduna,
- and Abuja.
These systems are characterised by:
- higher commercial orientation;
- greater use of purchased feed and veterinary inputs;
- improved breeds;
- confinement or semi-intensive management;
- and stronger market integration.
The systems dominate:
- feedlot fattening;
- and emerging commercial dairy operations.
The spatial distribution of livestock populations reflects Nigeria’s ecological diversity and production specialisation patterns.
| Region | Dominant Livestock System |
|---|---|
| North West | Extensive pastoral and agro-pastoral ruminant systems |
| North East | Pastoral and transhumant livestock systems |
| North Central | Mixed crop-livestock and agro-pastoral systems |
The 2023 NASC livestock census confirms that northern Nigeria remains the national centre of ruminant livestock production, while southern Nigeria is increasingly characterised by peri-urban livestock enterprises.
Despite increasing diversification and commercialisation, pastoral and agro-pastoral systems continue to underpin the national cattle economy and remain central to rural livelihoods, regional livestock trade, and domestic meat and milk supply.
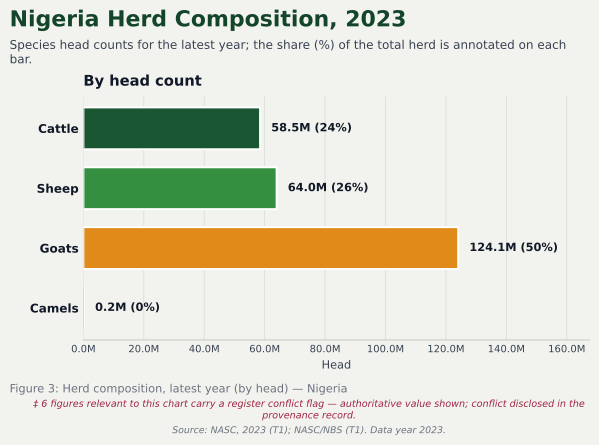
Over the past 50 years (approx. 1975–2025), Nigeria’s livestock population has experienced a steady upward trend in absolute numbers, driven by population growth and rising demand for animal protein. However, this growth has been largely extensive (relying on traditional, nomadic, or smallholder systems) rather than intensive.
2010–Present: A steady increase in cattle population has been observed, reaching 54.81 million by 2023 (NASS, 2023), reflecting sustained herd growth alongside improvements in livestock enumeration methodology.
2023 Snapshot: NASS 2023 reported 54.81 million cattle, 138.95 million goats, and 64.93 million sheep.
Ruminant Expansion: Cattle, sheep, and goat populations have increased, but they largely depend on natural pastures. The Northwest region hosts the highest population of ruminants, decreasing toward the south.
Low Productivity per Animal: Despite the increase in population, productivity per animal is low compared to international standards (e.g., Nigerian cattle produce low daily milk volumes compared to European counterparts).
Shift in Management: The sector is shifting slightly from traditional nomadic pastoralism toward more sedentary or intensive systems, especially in the south.
Population Growth: Rapid population growth has increased demand for meat and dairy products.
Urbanization: Increased urban population has boosted demand for processed livestock products.
Feed Costs & Disease: Rising feed costs, poor infrastructure, and animal diseases have presented challenges to sector growth.
Insecurity: Farmer-herder conflicts have impacted pastoralist activities.
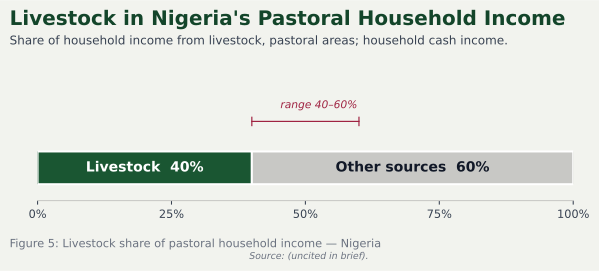
Livestock is a major source of household income, savings, insurance, and wealth accumulation, particularly in pastoral and agro-pastoral areas.
Income is generated through:
- live animal sales;
- milk;
- meat;
- hides and skins;
- manure;
- transport services;
- and animal traction.
| Indicator | Value | Year | Source |
|---|---|---|---|
| Average monthly Nigerian household incomes | USD ~200* | 2023- 2024 | Drived NBS NLSS 2018/19; inflated with NBS/CBN CPI; NBS GHS-Panel Wave 5 (2023/24); & CBN 2023 |
| Households engaged in livestock activities | 42.8% | 2023 | NBS/NASC |
| Agricultural households rearing livestock | 48% | 2023 | NBS/NASC |
| Pastoral population dependent on livestock | ~20 million | 2023 | NBS/NASC and literature synthesis |
| Livestock contribution to household cash income in pastoral areas | 40–60% | Triangulated | Triangulated from: LSMS-ISA 2010, FAO analysis of Nigeria GHS data; and sector estimates. |
| Households using livestock as savings/resilience asset | High prevalence (98%) | 2023 | NBS/NASC |
| Employment (hiring prevalence) | 84.9% (male), 71.1% (female); 99% for field prep | 2023 | NBS/NASC |
Note: *Average household income (USD ~200/month): This is an author-derived estimate constructed from: (i) NBS, Nigeria Living Standards Survey (NLSS) 2018/19 national poverty line (₦137,430/person/year); (ii) inflated to 2023 terms using NBS/CBN headline CPI (cumulative multiplier ≈2.19×); (iii) multiplied by average household size of 5.6 (NBS, General Household Survey Panel Wave 5, 2023/2024); (iv) converted to USD at the CBN 2023 official average exchange rate (₦634.16/US$1). Result: ≈USD 221/month, rounded to USD 200/month. This is an author-constructed estimate, not an official NBS/CBN/World Bank published figure no single Nigerian government or multilateral source publishes an aggregate "average household income" statistic.
FAO Nigeria livestock note (openknowledge.fao.org): cattle systems 30–100% of household income, based on NGHS (Nigeria General Household Survey) data, other several researches that reported 57.5% ; The 40-60% is a reasonable midpoint summary of this range for mixed/pastoral systems.
Livestock also performs important non-market functions including: dowry/bride price; social status; emergency coping;
Livestock generates both direct and indirect employment across Nigeria’s economy, particularly within rural and pastoral areas where livestock production remains labour-intensive and predominantly informal. Available national datasets and sector studies provide evidence across herding, production, processing, transport, veterinary services, and livestock marketing.
Direct employment occurs through livestock production and value-chain activities including herding, dairy production, slaughtering, processing, and livestock trading.
| Employment Area | Evidence/Data | Source |
|---|---|---|
| Herding and pastoral production | Approximately 20 million Nigerians are estimated to depend on pastoral and agro-pastoral livestock systems for livelihoods | NASC/NBS 2023 |
| Agricultural households engaged in livestock | About 42.8% of agricultural households engage in livestock-related activities | NASC 2023 |
| Rural population employed in livestock sector | Livestock sector employs about 30% of the rural population | AfDB/NIAS 2021 |
| Hide and Skin (Tanneries) | 18 functioning tanneries employ approximately 9,300 workers. These tanneries procure over 43 million skins annually, with a daily processing capacity exceeding 250,000 skins up to the wet blue stage. | ASSOMAC, 2023 |
| Projected new jobs under livestock reforms | National Livestock Growth Acceleration Strategy projects over 350,000 new livestock-sector jobs | FMLD 2025 |
The NBS livestock survey further confirms that livestock households utilise:
- paid male and female workers;
- unpaid household labour;
- apprentices;
- and seasonal labour across production systems.
Indirect employment arises through support services linked to livestock production, including feed supply, transport, veterinary care, processing infrastructure, extension services, and market logistics.
| Indirect Employment Area | Evidence/Data | Socio-economic Relevance | Source |
|---|---|---|---|
| Feed milling and feed supply | South West Nigeria accounts for over 75% of the country’s feed mills | Feed production supports employment in feed manufacturing, grain aggregation, and transport | NASC 2023 |
| Veterinary and animal health services | Veterinary services identified as critical to livestock productivity and rural livelihoods; increasing livestock commercialisation driving demand for veterinarians and para-veterinary workers | Supports employment in clinics, vaccination campaigns, pharmaceuticals, extension, and diagnostics | ILRI/FMLD |
| Livestock transport and logistics | Major livestock corridors linking Niger, Chad, Cameroon, Kano, Lagos, Maiduguri, and southern markets sustain extensive informal transport networks | Provides employment for drivers, loaders, brokers, aggregators, and market labourers | NASC 2023 / APS market systems |
| Hides, skins and leather processing | Nigeria slaughters nearly 7 million cattle annually; hides and skins value chains support traders, butchers, collectors, tannery agents, and leather processors | Kano remains Nigeria’s leather-processing hub with employment across tanning, leather works, footwear, and processing industries | ASSOMAC |
| Tanneries and leather manufacturing | 83.7% of cattle hides in some northern markets diverted to “ponmo” consumption instead of tanning | Demonstrates large informal employment around hides/skins trade and processing | ASSOMAC |
| Livestock market operations | Livestock markets operate extensive informal value chains involving brokers, marketers, slaughter workers, processors, and retailers | Supports thousands of informal workers across rural and urban markets | NASC 2023 |
| Input fabrication and machinery services | Livestock subsector engages Nigerians as technical workers, fabricators of tools and machinery, and input suppliers | Expanding livestock commercialisation increasing technical employment demand | |
| Direct and indirect livestock support services | Livestock sector provides employment for approximately 4.5–5 million Nigerians through direct and indirect support activities | Includes veterinary care, feed supply, transport, processing, and market services | |
| Youth and women skills development | Federal Ministry of Livestock Development developing training curricula for feedlotting, dairy, fodder, and leather works targeting 1,000 youths and women per state | Indicates emerging employment expansion in livestock technical services | NL-GAS/FMLD 2025 |
| Agricultural services employment | Agriculture employed over 25.3 million Nigerians (30.1% of total workforce) in 2023, with livestock forming a major subsector | NBS Labour Statistics |
The Federal Ministry of Livestock Development (FMLD) also recognises:
- veterinary care;
- market infrastructure;
- processing;
- logistics;
- aggregators;
- and input suppliers
as core employment-generating components of the livestock value chain.
Despite its importance, much livestock employment remains statistically underreported because:
- pastoral labour is largely informal;
- family labour dominates production systems;
- women-led processing activities are weakly captured;
- and cross-border livestock trade operates outside formal labour accounting systems.
Livestock remains one of the most important resilience assets for rural households in Nigeria, particularly in pastoral and dryland systems where formal insurance and financial services are limited. Animals function as mobile assets that can be sold, exchanged, consumed, or transferred during periods of economic and climatic stress. However, increasing insecurity, desertification, land degradation, flooding, and disease outbreaks are progressively weakening the resilience capacity of livestock-dependent households. Livestock plays a central resilience and risk-management role in Nigeria, particularly in pastoral, agro-pastoral, and dryland systems. Beyond income generation, livestock functions as:
- a household savings asset;
- insurance against shocks;
- an emergency cash reserve;
- a source of food during crises;
- and a socio-cultural safety net.
This role is particularly important in northern Nigeria where pastoral and agro-pastoral households depend heavily on cattle, sheep, goats, and camels for livelihood security.
The North West and North East zones alone account for approximately:
- 35.86 million cattle (65.42% of national cattle population);
- 73.34 million goats (52.79% of national goat population);
- and 45.9 million sheep (70.69% of national sheep population),
Highlighting the strategic importance of livestock as a resilience asset in dryland economies.
| Resilience Function | Evidence/Statistics | Household Welfare Contribution | Source |
|---|---|---|---|
| Livestock as savings/asset buffer | North West and North East jointly hold 35.86 million cattle (65.42% of national herd) | Animals sold during drought, illness, school fees, ceremonies, or food shortages | NASC 2023 |
| Livestock as food reserve | herds of 138.95 million goats and 64.93 million sheep | Provides meat, milk, and emergency household consumption during shocks | NASS 2023 |
| Mobility as climate adaptation | Pastoral mobility remains dominant across northern drylands | Seasonal migration enables access to pasture and water during drought periods | RIMS 1992; APS |
| Species diversification as resilience strategy | Households commonly keep mixed herds (cattle, goats, sheep, camels) | Reduces climate and disease risk exposure through diversified livestock assets | NASC 2023 |
| Livestock as livelihood security | Approximately 20 million pastoralists depend directly on livestock systems | Supports household income, transport, social obligations, and resilience | NASC 2023 |
| Livestock as insurance against crop failure | Mixed crop-livestock systems dominant in North West, East and Central | Livestock sales compensate for crop losses during poor rainfall seasons | APS/NAERLS |
Despite its resilience role, livestock systems are increasingly exposed to:
- conflict;
- desertification;
- land degradation;
- flooding;
- animal diseases;
- and insecurity.
These shocks are reducing the adaptive capacity of pastoral and agro-pastoral households.
| Shock Indicator | Evidence/Value | Socio-economic Impact | Source |
|---|---|---|---|
| Communities reporting livestock-related conflict nationally | 51.3% | Livestock conflict is the second most reported conflict type nationally | NASC 2023 |
| North Central communities reporting livestock conflict | 56.5% | Increased farmer-herder conflict and grazing pressure | NASC 2023 |
| North West communities reporting livestock conflict | 54.7% | Disruption of pastoral mobility and livestock markets | NASC 2023 |
| Communities affected by desertification in North East | 57.7% | Shrinking grazing land and water resources | NASC 2023 |
| Communities reporting increasing desertification in North East | 58.6% | Rising vulnerability of pastoral systems | NASC 2023 |
| Communities affected by land degradation in North East | 72.4% | Declining pasture and crop-residue availability | NASC 2023 |
| Communities affected by land degradation in North West | 56.2% | Increased feed scarcity and grazing competition | NASC 2023 |
| Communities reporting farmland abandonment in North East | 56.5% | Conflict and insecurity reducing land utilisation | NASC 2023 |
| Communities reporting increasing land abandonment in North West | 45.0% | Fragmentation of transhumance corridors | NASC 2023 |
Livestock-related conflicts are concentrated mainly within:
- North Central;
- North West;
- and North East Nigeria,
which are also the country’s major ruminant-producing zones. These conflicts affect:
- grazing access;
- water availability;
- veterinary service delivery;
- livestock marketing;
- and seasonal transhumance routes.
Environmental pressures further compound vulnerability. Over half of communities in the North East reported desertification and land abandonment, while more than 70% reported land degradation. These pressures reduce pasture availability and increase household exposure to food insecurity and distress livestock sales.
| Shock Type | Livestock System Effect | Household Welfare Effect |
|---|---|---|
| Conflict and insecurity | Cattle rustling, restricted grazing access, disrupted migration routes | Income loss, displacement, food insecurity |
| Desertification | Reduced pasture and water availability | Lower productivity and increased migration |
| Land degradation | Reduced fodder and crop residues | Increased feed costs and poor animal condition |
| Flooding | Livestock mortality and disease outbreaks | Asset depletion and reduced household income |
| Animal diseases | Mortality and productivity decline | Increased veterinary expenditure |
| Market disruptions | Reduced livestock sales and trade flows | Reduced household cash income |
Current datasets provide important evidence on the prevalence of shocks but major gaps remain regarding:
- livestock mortality rates during crises;
- economic value of livestock losses;
- household coping strategies;
- distress sales;
- recovery periods;
- and welfare impacts following shocks.
These gaps limit full quantification of livestock’s contribution to resilience, climate adaptation, and household welfare stabilisation in Nigeria.
Despite Nigeria’s large livestock population (54.8 million cattle), per capita consumption of animal-source foods remains low, particularly in the pastoral zones that produce the most livestock. Nationally, animal protein accounts for only 28.5% of total protein intake among women and 23.9% among children.
The North West and North East zones which together hold over 60% of Nigeria’s cattle, have the lowest share of protein intake from animal sources (21.2% and 17.8%, respectively) and the highest stunting rates (53.2% and 51.8%). Only 12.4% of children aged 6–23 months consume a minimum acceptable diet that includes animal-source foods.
These findings indicate a critical decoupling between livestock production and local nutrition: pastoral households are producing livestock but not consuming animal-source foods at adequate levels. Improving nutrition outcomes in pastoral areas requires nutrition-sensitive livestock interventions that promote household consumption of milk and meat alongside commercial sales, combined with nutrition education and women’s empowerment programmes.
Direct per capita consumption data in kilograms per year are not available in nationally representative household surveys. However, the 2021 National Food Consumption and Micronutrient Survey (NFCMS) collected quantitative 24-hour dietary recalls, allowing estimation of usual intake in grams per day, which can be converted to annual estimates.
| Indicator | Women (15–49 yrs) | Children (24–59 months) | Source |
|---|---|---|---|
| Animal protein intake (g/day) | 13.6 | 6.9 | NFCMS 2021 |
| Estimated meat/fish intake (g/day) | ~68 | ~35 | Calculated (assumes 20% protein) |
| Estimated meat/fish intake (kg/year) | ~24.8 | ~12.8 | Calculated (g/day × 365 ÷ 1000) |
| Milk consumption (kg/year) | Not nationally significant | Not nationally significant | NFCMS 2021 – only significant in North West via Fura da nono |
| Egg consumption (kg/year) | Not in top 10 nationally | Not nationally significant | NFCMS 2021 – only significant in South West |
| Zone | Beef (kg/year) | Fish (kg/year) | Total Meat/Fish (kg/year) |
|---|---|---|---|
| South South | 1.64 | ~4.3 | ~5.9 |
| South West | 1.06 | ~5.9 | ~7.0 |
| South East | 1.31 | ~2.5 | ~3.8 |
| North Central | 0.84 | ~0.9 | ~1.7 |
| North West | Not in top 10 | None in top 10 | ~1.3 (Fura da nono) |
| North East | 0.51 | None in top 10 | ~0.5 |
Source: NFCMS 2021 Annex 12, converted to kg/year
Key finding: A person in the South South zone consumes approximately 12 times more animal-source foods (5.9 kg/year) than a person in the North East zone (0.5 kg/year).
| Population Group | Animal Protein (g/day) | Plant Protein (g/day) | Animal Protein % |
|---|---|---|---|
| Women (15–49 years) – National | 13.6 | 34.5 | 28.5% |
| Children (24–59 months) – National | 6.9 | 22.3 | 23.9% |
Source: NFCMS 2021
| Zone | Animal Protein (g/day) | Plant Protein (g/day) | Animal Protein % |
|---|---|---|---|
| South South | 23.4 | 26.3 | 47.1% |
| South East | 19.7 | 30.9 | 38.9% |
| South West | 20.3 | 33.0 | 38.1% |
| North Central | 11.5 | 31.7 | 26.6% |
| North West | 11.0 | 41.0 | 21.2% |
| North East | 7.8 | 36.0 | 17.8% |
Source: NFCMS 2021
Critical policy finding: The North West and North East zones – which together account for over 60% of Nigeria’s cattle population (17.86M and 17.99M cattle respectively) – have the lowest share of protein from animal sources (21.2% and 17.8%). Conversely, the South South zone – with only 0.31 million cattle (0.6% of the national herd) – has the highest share (47.1%). This indicates a decoupling of livestock production from local consumption: pastoral zones produce livestock but do not consume animal-source foods at adequate levels.
The NDHS 2023–24 does not directly measure household livestock ownership. However, the strong geographic overlap between livestock-producing zones (North West and North East) and zones with the worst child nutrition outcomes allows for robust inference.
| Zone | Stunting (%) | Wasting (%) | Underweight (%) | Livestock System | Animal Protein % (Women) |
|---|---|---|---|---|---|
| North West | 53.2% (highest) | 8.3% | 33.8% (highest) | Extensive pastoral (17.86M cattle) | 21.2% (lowest) |
| North East | 51.8% | 8.1% | 33.4% | Pastoral + transhumant (17.99M cattle) | 17.8% (lowest) |
| North Central | 36.8% | 6.5% | 21.1% | Mixed crop-livestock | 26.6% |
| South West | 21.2% | 11.0% | 21.8% | Peri-urban intensive | 38.1% |
| South East | 20.6% | 7.0% | 16.0% | Small ruminant | 38.9% |
| South South | 17.9% (lowest) | 11.3% (highest) | 16.8% | Mixed smallholder | 47.1% (highest) |
Source: NDHS 2023–24; NFCMS 2021
Critical finding: The North West and North East zones – which host the highest ruminant livestock populations (17.86M and 17.99M cattle respectively) and where pastoral systems dominate, have the highest stunting rates (53% and 52%) in the country. This paradox suggests that livestock ownership at the community level does not automatically translate into improved child nutrition .
| Wealth Quintile | Stunting (%) | Underweight (%) |
|---|---|---|
| Lowest (poorest) | 55.9% | 38.9% |
| Second | 52.5% | 32.2% |
| Middle | 41.1% | 24.8% |
| Fourth | 30.0% | 22.3% |
| Highest (richest) | 14.7% | 12.3% |
| Mother’s Education | Stunting (%) | Underweight (%) |
| No education | 55.1% | 36.2% |
| Primary | 40.5% | 26.2% |
| Secondary | 28.9% | 21.0% |
| More than secondary | 14.0% | 9.8% |
Source: NDHS 2023–24; NFCMS 2021
Interpretation: Pastoral households (especially in North West/North East) often have low maternal education and low wealth quintile status. The NDHS data demonstrate that both poverty and low education are strongly associated with child undernutrition. Therefore, even when livestock are present, poor and less-educated households may not translate livestock assets into improved child nutrition due to lack of knowledge, market access, or control over resources.
| Indicator | National (%) | Relevance |
|---|---|---|
| Minimum dietary diversity (MDD) 6–23 months | 12.4% | Only 1 in 8 children consume a diverse diet that includes meat, eggs, or dairy |
| Exclusive breastfeeding under 6 months | 28.8% | Very low |
| Sweet beverage consumption 6–23 months | 41.2% | Displaces nutrient-dense foods |
Source: NDHS 2023–24
Key finding: MDD (12.4%) means that the vast majority of young children do not regularly consume animal-source foods – a major concern given Nigeria’s large livestock population.
| Indicator | Value | Source |
|---|---|---|
| Per capita meat/fish consumption (national) | ~24.8 kg/year (women); ~12.8 kg/year (children) | NFCMS 2021 (converted) |
| Share of protein from animal sources (women) | 28.5% (national); ranges from 17.8% (North East) to 47.1% (South South) | NFCMS 2021 |
| Share of protein from animal sources (children) | 23.9% (national) | NFCMS 2021 |
| Stunting in pastoral zones (North West + North East) | 52.5% average (vs. 19.9% in southern zones) | NDHS 2023–24 |
| Minimum Dietary Diversity (children 6–23 months) | 12.4% (only 1 in 8 children consume ASF) | NDHS 2023–24 |
| Wealth gradient in stunting | 55.9% (lowest quintile) vs. 14.7% (highest) | NDHS 2023–24 |
| Maternal education gradient in stunting | 55.1% (no education) vs. 14.0% (post-secondary) | NDHS 2023–24 |
Nigeria’s domestic livestock markets are supplied primarily by the northern zones (North West, North East, and North Central), which together hold over 80% of the national cattle population. Livestock processing infrastructure is limited, with only 36.8% of communities reporting processing activities and 23.9% having slaughterhouse facilities.
Milk processing is virtually non-existent outside the North West (1.5% of communities). Cross-border informal trade with Niger, Chad, Cameroon, and Benin is significant but unrecorded, meaning pastoral contributions to regional trade are invisible in national statistics. Market integration is highly uneven: zones with the highest livestock production (North West and North East) have the lowest animal protein consumption (21.2% and 17.8% of protein from animal sources) and the highest stunting rates (53.2% and 51.8%), while southern zones with minimal livestock production but better market integration have the highest consumption and lowest stunting. Conflict (51.3% of communities) and environmental degradation (57.7% desertification in North East) severely constrain market access, particularly in border states.
Critical data gaps include no offtake rates, no price data, no informal trade estimates, and no detailed market infrastructure mapping all of which constrain policy recognition of pastoral contributions to markets and trade.
| Aspect | Finding | Source |
|---|---|---|
| Total documented livestock markets | ~700+ across 36 states + FCT | FMLD Market Inventory |
| State with most markets | Bauchi (130), Delta (51), Katsina (34), Adamawa (35), Ondo (32), Oyo (32), Kogi (30), Lagos (28) | FMLD Market Inventory |
| Border market states | Adamawa (Mubi), Katsina (Kara Mai’adua, Jibia, Daura, Kaita), Jigawa (Maigatari, Gujungu), Sokoto (Illela), Zamfara (Shinkafi), Yobe (Nguru) | FMLD Market Inventory |
| Specialized market types | Cattle-only, sheep/goat, donkey/camel | FMLD Market Inventory |
| Livestock processing coverage | 36.8% of communities | Table 19 |
| Slaughterhouse coverage | 23.9% of communities | Table 19 |
| Milk processing coverage | 1.5% of communities | Table 19 |
A comprehensive inventory compiled by the Federal Ministry of Livestock Development identifies over 700 livestock markets across Nigeria’s six geopolitical zones, with major concentrations in the North West (70+ markets), North East (90+), and South West (90+). Key cross-border markets include Illela (Sokoto-Niger), Maigatari (Jigawa-Niger), Dankama (Katsina-Niger), Jibiya (Katsina-Niger)and Mubi (Adamawa-Cameroon), which serve as critical nodes for informal regional trade. Major transit markets for large animals includes Potiskum (Yobe), Azare (Bauchi), Wudil and Danbatta Market (Kano) Major terminal markets such as Bodija (Ibadan), Ajah (Lagos), and Gusau Kara (Zamfara) link pastoral producers to urban consumers. This market inventory provides a baseline for infrastructure investment, price monitoring, and trade flow analysis.
As presented in Section 2, Nigeria’s livestock population is highly concentrated in the northern zones. The North West and North East zones together account for over 60% of the national cattle population (17.86 million and 17.99 million respectively). The North Central zone holds an additional 16.8 million cattle. These zones therefore serve as the primary supply basins for domestic livestock markets.
Markets are categorized by the types of livestock traded (cattle, sheep, goats, camels, donkeys) and by market days (daily, weekly, or seasonal).
From Table 18 (Domestic Livestock Markets and Basic Infrastructure) and Table 19 (Agricultural processing facilities), livestock processing infrastructure remains limited:
| Facility | % Communities (National) |
|---|---|
| Livestock processing | 36.8% |
| Slaughterhouse | 23.9% |
| Facility for processing of milk | 1.5% |
| Crop processing | 67.5% |
The contrast between crop processing (67.5%) and livestock processing (36.8%) reflects historical policy bias toward crops. Milk processing (1.5%) is virtually non-existent outside the North West zone, where Fura da nono (fermented milk-cereal mixture) is produced. This gap represents a major missed opportunity given that pastoralists account for an estimated 90–95% of local milk production.
Pastoralists: As documented in Section 2, pastoral and agro-pastoral systems dominate ruminant production in the North West, North East, and North Central zones. Pastoralists are the primary suppliers to the markets listed above, particularly the northern cattle markets (Mubi, Chigari, Ngurore, Wudil, Falgore, Kara markets in Katsina, Maigatari, etc.).
Traders and Intermediaries: The market inventory reveals a dense network of livestock markets connected by informal trading networks. Traders move livestock from northern production markets (e.g., Mubi, Wudil, Falgore) to southern consumption markets (e.g., Bodija in Ibadan, Oyingbo in Lagos, Mile 3 in Port Harcourt, Rumuokoro in Rivers). This north-south flow confirms the market integration pattern identified in Section 4.3.
Processors: Slaughterhouses and processing facilities are concentrated in urban centres (e.g., Agege Abattoir in Lagos, Trans Amadi Slaughter in Port Harcourt, Otukpo abattoir in Benue). The market inventory shows that most rural markets lack formal slaughter facilities, meaning animals are transported live to urban centres for slaughter and processing.
Consumers: As shown in Section 3.4, animal protein consumption is highest in southern zones (South South 47.1%, South East 38.9%, South West 38.1%) despite these zones having minimal livestock populations. The market inventory confirms that southern states (Lagos, Oyo, Delta, Rivers, Ondo) have numerous livestock markets that serve as terminal points for northern-origin livestock.
The inventory also reveals geographic and infrastructural constraints:
Road network and transport: Many markets are located far from major highways, increasing transport costs and animal mortality. Border markets (e.g., Mubi, Maigatari, Kara Mai’adua) suffer from poor road conditions, especially during the rainy season.
Conflict-affected markets: Several markets in Borno (4 markets), Yobe (4), and parts of Adamawa, Taraba, and Katsina are located in conflict-prone areas. Insecurity has reduced market days, increased transaction costs (bribes, security payments), and in some cases forced market closures.
Seasonal markets: Some markets operate only during dry seasons or around religious festivals (Eid al-Adha, Sallah). The inventory includes weekly markets (e.g., Isanlu Weekly Market in Kogi) that are not daily, indicating limited market integration for some pastoral communities.
Lack of veterinary infrastructure: Most markets lack on-site veterinary posts, disease surveillance, or quarantine facilities. This increases the risk of disease transmission and limits market access for disease-free certified animals.

| Trade Flow | Value (USD M) | Year | Formality | Key Partners | Source |
|---|---|---|---|---|---|
| Live Animal Exports | 0.65 | 2023 | Formal | Netherlands, Belgium, United States, Malaysia and Ghana. | UN COMTRADE / WITS |
| Meat Exports | < 0.20 | 2024 | Formal | Not specified | UN COMTRADE / OEC |
| Hides/Skins Exports | 10.9 | 2023 | Formal | Spain, Italy,India, China | EU-Nigeria Agribusiness Platform |
| Informal Cross-Border Exports | Estimated 60-85% of total trade | 2023-2024 | Informal | Niger, Chad, Cameroon, Benin | OECD/SWAC & CILSS data |
| Live Animal Imports | 1.07 | 2023 | Formal | Chile, New Zealand, Netherlands, Faeroe Islands, South Africa and Ireland | UN COMTRADE/ WITS, Trading Economics |
| Meat Imports | 1.67 | 2024 | Formal | China, Italy, Brazil, Argentina, USA, Namibia, Botswana, South Africa | UN COMTRADE / OEC (see Note) |
Note: The meat import figure of $1.67 million is derived from UN COMTRADE data via the Observatory of Economic Complexity (OEC) and covers formal, recorded imports of meat and edible offal (HS Code 02) in 2024. This figure does not include informal or smuggled meat imports, which are believed to be substantial. Another data from OEC showed Key suppliers include South Africa ($2.21M), Italy ($1.57M), China ($0.52M), and others, while $1.67 million only is reported by others alone which amount to $6.75M (full HS Code 02 + preparations)
From the NASC 2023 livestock population data, the following Border States have significant livestock populations and are likely nodes for cross-border trade:
| State | Zone | Cattle Population | International Border With | Trade Corridor |
|---|---|---|---|---|
| Borno | North East | 893,100 | Chad, Cameroon, Niger | North East Corridor |
| Yobe | North East | 1,670,865 | Niger | North East Corridor |
| Taraba | North East | 2,111,517 | Cameroon | North East Corridor |
| Adamawa | North East | 3,309,459 | Cameroon | North East Corridor |
| Jigawa | North West | 2,716,838 | Niger | North West Corridor |
| Sokoto | North West | 1,420,717 | Niger (Very close to Benin) | North West Corridor |
| Kebbi | North West | 2,826,593 | Benin, Niger | North West Corridor |
| Katsina | North West | 1,745,109 | Niger | North West Corridor |
Source: NASS 2023
Key trade corridors identified from regional studies:
North West Corridor: Through Sokoto, Kebbi, and Katsina states into Niger and Benin. This corridor handles significant cattle, goat, and sheep movements , particularly during the dry season and around religious festivals (Eid al-Adha, Sallah).
North East Corridor: Through Borno, Yobe, Taraba, and Adamawa states into Chad and Cameroon. This corridor is critical for cattle and camel trade but is severely constrained by insecurity (Boko Haram, farmer-herder conflict).
Regional livestock trade operates on well-established trade corridors, with close to two-thirds of all animals shipped internationally within West Africa. Of the nine key markets identified in regional studies, three are close to Nigerian borders, highlighting Nigeria’s importance as a livestock consumption destination for regional livestock production.
| Partner Country | Direction | Key Products | Notes |
|---|---|---|---|
| Niger | Export and Import | Cattle, goats, sheep | Porous border; significant informal trade |
| Chad | Export and Import | Cattle, camels | Affected by insecurity in Borno |
| Cameroon | Export and Import | Cattle, goats, sheep | Taraba and Adamawa corridors |
| Benin | Export | Cattle, goats, sheep | Re-export hub to other West African countries |
| Ghana | Export | Cattle, sheep | Longer-distance trade via Benin and Togo |
| Italy, Spain | Export | Hides and skins (tanned/crust) | Primary EU destinations for Nigerian leather |
| Netherlands, Ukraine, Russia | Import | Frozen fish/meat | Source of frozen meat imports |
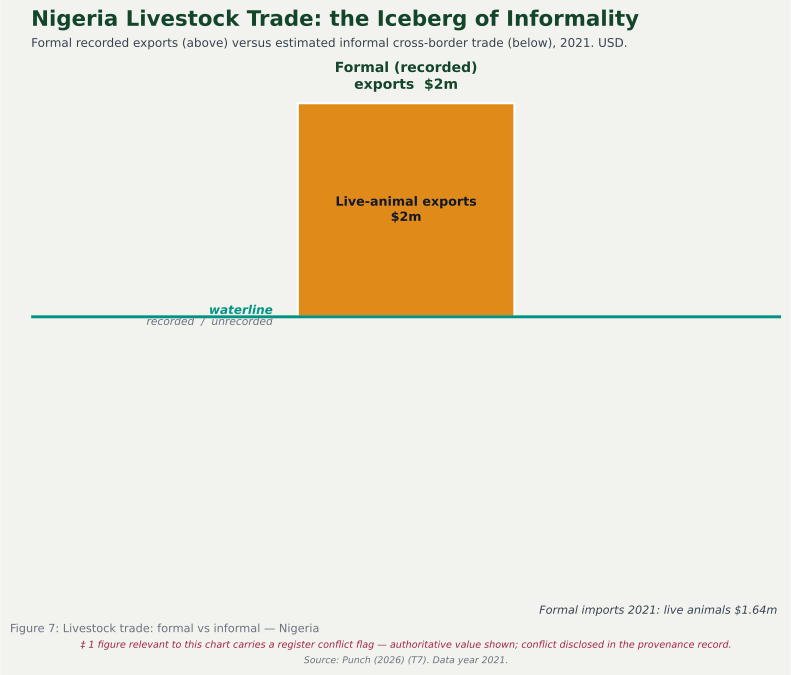
The disparity between formal and informal trade is significant. Regional studies suggest that informal cross-border livestock trade may account for 60–85% of total trade volumes in West Africa.
Indirect evidence from reviewed datasets supports the existence of a large gap:
High livestock populations in Border States: The eight Border States listed above collectively hold over 16 million cattle , more than 30% of the national herd. If even a small percentage of these animals cross borders annually, informal trade volumes would be substantial.
Processing infrastructure gap: Only 36.8% of communities have livestock processing facilities. The low processing capacity means that most livestock are exported live rather than as processed meat, which is more conducive to informal trade.
Conflict and informal trade: Livestock-related conflict affects 51.3% of communities nationally , with higher rates in border zones. Insecurity may push traders toward informal channels to avoid official checkpoints.
The disparity between formal and informal trade is vast. Nigeria's formal livestock exports were less than $2 million in 2021, yet the country spent $1.64 billion on livestock imports in 2024, a massive trade deficit. This trend has continued into 2025: in the first half alone, Nigeria imported approximately $601 million worth of livestock products against exports of only about $38 million, leaving a trade deficit of approximately $563 million. These import figures are driven largely by dairy products. Regional data suggests that informal trade accounts for an estimated 60–85% of total livestock trade volumes in West Africa (OECD/SWAC, 2020; CILSS, 2023), meaning the actual scale of cross-border livestock flows is likely many times larger than official figures suggest.
Nigeria spends an estimated $1.2–1.5 billion annually on dairy products imports. Domestic milk production (500,000–700,000 tonnes per year) meets only about one-third of national consumption (1.6 billion litres), leaving a supply gap of nearly 1 billion litres that must be imported.
Estimated gap (indicative – requires primary data)
| Indicator | Formal (Recorded) | Informal (Estimated) | Formal Share |
|---|---|---|---|
| Live cattle exports (head/year) | Unknown | Estimated >100,000 | <30% (estimated based on regional patterns) |
| Small ruminant exports (head/year) | Unknown | Estimated >500,000 | <20% (estimated based on regional patterns) |
Data gap statement: These estimates are illustrative based on regional studies. Primary data collection through border market surveys is urgently needed to establish baseline informal trade volumes for Nigeria specifically.
This is the analytical core of the brief. Using the evidence presented in Sections 2 and 3, this section analyzes how market integration (or lack thereof) affects socio-economic outcomes for pastoral communities. It examines how access to markets affects income and livelihood security, identifies barriers to market access, assesses how informal trade affects official recognition of pastoral contributions, and considers how market price dynamics affect pastoral welfare.
Nigeria’s pastoral zones present a striking paradox. The North West and North East zones together hold over 60% of the nation’s cattle (35.86 million head) and the majority of its goats and sheep. Yet, as demonstrated in Section 3.4, these same zones record the lowest animal protein consumption and the highest child stunting rates in the country.
| Indicator | North West | North East | South South |
|---|---|---|---|
| Share of national cattle | 32.6% | 33.0% | 0.6% |
| Animal protein (% of total protein, women) | 21.2% | 17.8% | 47.1% |
| Child stunting rate | 53.2% | 51.8% | 17.9% |
Sources: NASC 2023; NFCMS 202; NDHS 2023–24
Analytical insight: Pastoral zones are net producers of livestock but net consumers of very little animal-source food. The livestock products they produce are overwhelmingly marketed to southern urban consumers rather than retained for local household consumption. This decoupling between production and local nutrition is a market integration failure with severe welfare consequences.
Positive effects where markets function:
From Section 3.2 (Employment), the livestock sector provides direct and indirect employment to an estimated 4.5–5 million Nigerians. The National Livestock Growth Acceleration Strategy projects over 350,000 new jobs. This demonstrates that market-oriented livestock systems generate significant income opportunities.
From Location of workers hired data, over half of hiring involves labour from both within and outside the community (53.9% for males, 55.6% for females). This indicates that livestock labour markets extend beyond village boundaries, creating income flows for landless and asset-poor households who can sell their labour to wealthier pastoralists.
From Section 3.1 (Household Income), livestock contributes an estimated 40–60% of household cash income in pastoral areas. This income is used for food purchases, school fees, healthcare, and ceremonies.
Negative effects where markets fail:
Despite these positive indicators, pastoralists face significant constraints that limit their ability to benefit from market integration:
Distress sales due to shocks: During drought, desertification, or conflict, pastoralists are forced to sell animals at low prices because they lack alternative coping mechanisms. As shown in Section 3.3, desertification affects 57.7% of North East communities and land degradation affects 72.4%, creating recurrent pressure for distress sales.
Low farmgate prices: With limited processing infrastructure (only 36.8% of communities have livestock processing, Section 4.1) and weak market integration, pastoralists receive low prices for live animals, milk, and hides. By contrast, the same products fetch much higher prices in southern urban markets, with the difference captured by intermediaries.
Dairy value chain failure: Nigeria spends an estimated $1.2–1.5 billion annually on dairy imports (Section 4.2), yet pastoralists produce 90–95% of local milk. The domestic milk value chain is almost non-existent, with only 1.5% of communities having milk processing facilities (Section 4.1). Pastoralists cannot access higher-value processed dairy markets and instead sell raw milk at very low prices. The result is a massive import bill that could be reduced if pastoral dairy were integrated into formal markets.
The evidence from Sections 2 and 3 identifies multiple, mutually reinforcing barriers:
Barrier 1: Conflict and Insecurity
From Table 8 (Section 3.3), livestock-related conflict affects 51.3% of communities nationally, with rates exceeding 50% in North Central (56.5%), North West (54.7%), and even South West (52.8%). For pastoral communities, conflict:
- Blocks traditional transhumance routes, forcing herds onto smaller, degraded grazing areas
- Increases mortality and theft (cattle rustling)
- Disrupts access to markets, especially during peak trading seasons (e.g., Eid al-Adha)
- Raises transaction costs (bribes, security payments, longer routes)
Barrier 2: Environmental Degradation
From Section 3.3 (Tables 8, 9), and Section 3.4.1 Table 10, desertification, land degradation, and land abandonment are not just ecological problems—they are market access problems. When pasture and water become scarce:
- Pastoralists must sell animals earlier than planned (distress sales)
- Animals arrive at markets in poor condition, fetching lower prices
- Migration routes lengthen, increasing transport costs and animal mortality
Barrier 3: Weak Processing Infrastructure
As shown in Section 4.1 (Table 4), only 36.8% of communities have livestock processing facilities. This means most livestock products leave pastoral areas in raw, unprocessed form. Pastoralists capture none of the value added from processing (slaughtering, packaging, grading, branding, by-product recovery). The contrast with crop processing (67.5% of communities) reflects historical policy bias toward crops over livestock.
Barrier 4: Limited Market Information
Price data are not collected systematically. Pastoralists have no way of knowing prevailing prices in different markets, making them vulnerable to exploitation by traders. The absence of price information also means pastoralists cannot time their sales to coincide with peak demand (e.g., religious festivals) or avoid low-price periods.
Barrier 5: Informal Trade and Border Constraints
For pastoralists near borders (Borno, Yobe, Taraba, Adamawa, Jigawa, Sokoto, Kebbi, Katsina—see Section 4.2, Table 20 and 21), informal cross-border trade offers potential access to regional markets (Niger, Chad, Cameroon, Benin). However, insecurity along these borders makes cross-border movement dangerous. Moreover, because the trade is informal and unrecorded, pastoralists have no official recognition, no access to trade finance, and no legal protection when disputes arise.
From Section 4.2, informal cross-border livestock trade accounts for an estimated 60–85% of total trade volumes in West Africa. For Nigeria, this means:
Statistical invisibility: Pastoral contributions to regional trade, foreign exchange earnings, and food security are not captured in official statistics (NBS customs data, balance of payments, GDP calculations).
Policy neglect: Because pastoral trade is invisible, policymakers do not see pastoralists as significant economic actors. Investment in pastoral infrastructure (markets, veterinary posts, water points, roads) is therefore under-prioritized.
No bargaining power: Without official recognition, pastoralist associations have little leverage in policy negotiations (e.g., over grazing reserves, transhumance routes, border closures).
Exclusion from trade agreements: Regional trade protocols (ECOWAS) may not adequately address pastoral mobility because the scale of informal trade is not recognized.
Evidence from the dairy import gap: Nigeria spends $1.2–1.5 billion annually on dairy imports (Section 4.2), yet pastoralists produce 90–95% of local milk. If informal dairy marketing were formalized and supported, this import bill could be substantially reduced. The fact that it has not been reduced indicates a major failure of policy recognition.
Although systematic price data are not available in the datasets, the indirect evidence reveals several price-related dynamics that harm pastoral welfare:
Price volatility: Pastoralists face highly volatile prices driven by seasonal factors (prices drop after rains when animals are fat; prices rise before festivals) and shock events (drought, conflict, disease outbreaks cause price collapses). Import competition (cheaper imported dairy) further depresses local prices.
Price transmission failure: Prices received by pastoralists (farmgate) are much lower than prices paid by urban consumers. The difference is captured by intermediaries. With no processing infrastructure, pastoralists cannot bypass intermediaries by selling processed products.
Price information asymmetry: Pastoralists lack access to real-time price information, while traders have better information. This asymmetry allows traders to offer lower prices than pastoralists might otherwise accept.
Distress sale discount: When pastoralists are forced to sell during crises, they receive prices significantly below the long-term average. This discount is a direct welfare loss that could be avoided if pastoralists had access to livestock insurance, better market information, storage/processing facilities, or credit to allow them to hold animals until prices recover.
Table 25 Drawing together the evidence, pastoral communities in Nigeria face a livelihood security trap:
| Factor | Constraint | Outcome |
|---|---|---|
| Production | High livestock populations in drylands | Potential for market income |
| ↓ | Conflict, desertification, degradation | Reduced productivity, increased mortality |
| Market access | Weak infrastructure, informal trade, insecurity | High transaction costs, distress sales, deals with cash |
| ↓ | Low prices, captured by intermediaries | Low pastoral income |
| Income use | Income spent on food, healthcare, ceremonies | Little retained for investment |
| ↓ | Limited savings, no insurance | High vulnerability to shocks |
| Nutrition | Livestock products sold, not consumed at home | High stunting, low animal protein intake |
| ↓ | Weak, malnourished children | Intergenerational poverty |
This trap is self-reinforcing. Pastoralists sell animals at low prices, earn low incomes, cannot invest in herd improvement or market infrastructure, remain vulnerable to shocks, and their children suffer malnutrition that reduces future earning potential.
5.1 Summary of Main Findings
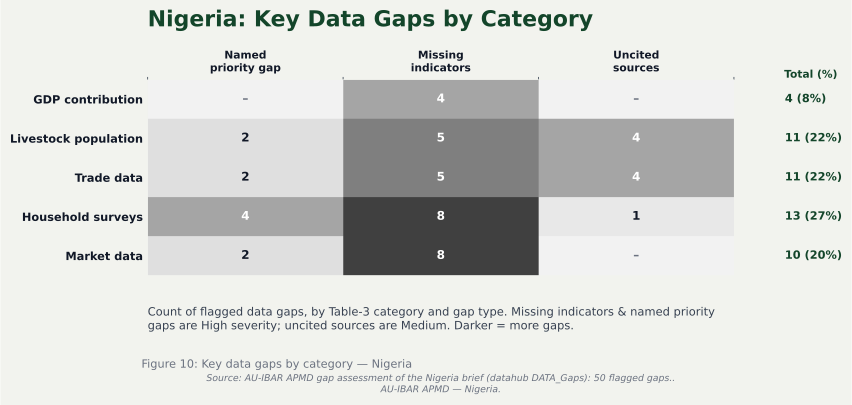
This section identifies critical data gaps and measurement limitations that constrain the full recognition of pastoral and livestock contributions to Nigeria’s economy, employment, trade, resilience, and nutrition. Each gap is substantiated by evidence from the available datasets (NASC 2023, NDHS 2023–24, NFCMS 2021, NBS community surveys) and the analysis presented in Sections 2, 3, and 4. Recommendations for addressing each gap are grounded in feasible, actionable next steps for the National Bureau of Statistics (NBS), Federal Ministry of Livestock Development (FMLD), and AU-IBAR.
| Data Category | Gap Description | Impact on Recognition | Possible Action |
|---|---|---|---|
| GDP Contribution | Livestock GDP (3.1% of national, 13.2% of ag GDP) likely underestimates sector value because informal trade, non-market functions (manure, draft power, insurance, savings), and pastoral mobility are not captured. | Pastoral systems appear less economically significant, leading to underinvestment in livestock infrastructure, extension, and veterinary services. | Conduct a Satellite Account for Livestock that values non-market functions; integrate informal trade estimates from border market surveys. |
| Livestock Population & Productivity | NASC and NASS 2023 provides excellent population data, but no productivity metrics (milk yield per cow, off-take rates, calving rates, mortality) are collected alongside census enumerations. | High population numbers suggest sector importance, but low productivity per animal (historically documented) is not systematically tracked, masking inefficiencies. | Integrate productivity modules into future NASC rounds (e.g., daily milk yield, mortality rates, age at first calving) for a representative subsample of pastoral and agro-pastoral households. |
| Employment & Wages | Community surveys (2022) collect only binary (yes/no) hiring data (e.g., 99% of communities hire labour) but no data on number of hired workers, wages paid, days worked, or formal vs. casual status. LSMS-ISA (2010) shows only 25% of rural households have any wage income, but livestock-specific wage data absent. | The 99% hiring figure is misleading (includes casual/exchange labour), while true formal wage employment in livestock is unknown. Prevents tracking of 350,000 new jobs target and USD 51.85 minimum wage compliance. | Add a livestock wage employment module to the next GHS-LSMS round, capturing number of hired workers per household, wages (cash and in-kind), days worked, and employer type. |
| Household Income & Diversification | LSMS-ISA (2010) shows ~60% of households engage in agriculture and ~40% sell livestock. No recent (post-2010) household-level data on what percentage of total household income comes from livestock , nor how this varies by zone, production system, or gender. | Policymakers cannot identify livestock-dependent households (e.g., pastoralists vs. diversified smallholders), leading to poorly targeted interventions. | Conduct a specialized pastoral household survey (oversampling North West and North East) with detailed income disaggregation: crop sales, livestock sales, milk sales, hides/skins, wage labour, non-farm enterprise, and transfers. |
| Livestock-Related Conflict | Community survey shows livestock-related conflict is Rank 1 cause nationally (51.3% of communities). However, no data exists on the economic impact : value of livestock lost, displacement of herders, reduction in marketed off-take, or income losses. | Conflict is recognized as a problem, but its economic cost to the livestock sector is not quantified. Weakens investment case for conflict resolution mechanisms, livestock routes, and grazing reserves. | Integrate conflict impact modules into pastoral surveys, capturing number of livestock lost to conflict in past 12 months, estimated value, displacement duration, and income loss. Link to NBS conflict data. |
| Trade Data (Formal vs. Informal) | Nigeria has formal trade data (NBS customs, UN Comtrade), but the vast majority of cross-border livestock movement (especially with Niger, Chad, Cameroon, Benin) is informal and unrecorded . Available datasets contain no informal trade estimates. | Pastoral contributions to regional food security and trade are invisible in national statistics; livestock GDP is underestimated. | Conduct border market surveys at major informal crossing points (Maiadua, Illela, Jibiya, Mfun, Gamboru, Mubi) to estimate volumes and values of informal livestock, meat, and hide trade. Use these to adjust trade statistics. |
| Market Integration & Price Data | No systematic data on livestock prices at different market levels (village, secondary, terminal) or on price transmission from pastoral to consumer markets. Community surveys do not capture market access distances or price information. | Without price data, impossible to assess whether pastoralists receive fair prices, how market integration affects welfare, or where value chain inefficiencies lie. | Establish a livestock price monitoring system across 30-50 key markets (including pastoral assembly markets) with monthly collection of prices for cattle, goats, sheep, camels, hide/skin, and milk. Publish price bulletins. |
| Gender Disaggregation | Both community data (2022) and LSMS-ISA (2010) show persistent gender gaps: male farmers hire labour more (84.9% vs. 71.1%), and men twice as likely to have wage work (14% vs. 8%). No data on women’s ownership of livestock , control over livestock income , or time allocation to livestock activities vs. domestic work. | Gender-blind policies fail to address structural inequalities. Women’s contributions (small ruminants, milk processing) remain invisible; interventions may inadvertently exclude them. | Add gender-disaggregated modules to household surveys, capturing livestock ownership by species and household member, control over income, time use, and access to extension/veterinary services by gender. |
| Health & Nutrition Outcomes | No data linking livestock ownership or livestock-derived income to nutrition outcomes (stunting, wasting, anemia, dietary diversity). NDHS 2023–24 does not collect livestock assets. | The argument that livestock improves nutrition (especially for children in pastoral households) cannot be empirically demonstrated, weakening advocacy for livestock-nutrition programming. | Integrate livestock asset modules (species, number owned, milk production) into the next NDHS or LSMS round. Include child anthropometry and dietary diversity modules. |
| Climate & Environmental Data | No data on livestock-related greenhouse gas emissions , carrying capacity of grazing lands , desertification trends , or water availability for livestock . Tables 8, 9, 10 show desertification, degradation, and abandonment but no link to livestock productivity or pastoral vulnerability. | Without environmental data, the livestock sector’s sustainability cannot be assessed, nor can climate adaptation strategies be evidence-based. | Link livestock data to remote sensing data (NDVI, rainfall, land surface temperature) to model carrying capacity and vulnerability. Integrate rangeland health indicators into future NASC rounds. |
| Post-Harvest & Processing | Data shows crop processing (67.5% of communities) but livestock processing is only 36.8% ; milk processing is only 1.5% . No data on waste, losses, or value addition along livestock value chains. | The livestock sector appears as a primary production sector only, missing significant employment and value added from processing (cheese, cured meat, hides, leather). | Conduct a livestock value chain mapping study for beef, dairy, small ruminants, and hides/skins, quantifying losses, value addition, and employment at each stage (production, assembly, transport, processing, retail). |
6.1 Summary of Main Findings
Nigeria’s livestock sector is a major economic asset, contributing 3.1% of national GDP (NGN 1.57 trillion; NBS GDP Report Q1 2026) and 13.2% of agricultural GDP in 2025. The country possesses one of the largest livestock populations in its region: 54.81 million cattle, 138.95 million goats, and 64.93 million sheep (NASS, 2023). Pastoral and agro-pastoral systems support an estimated 20 million Nigerians and dominate ruminant production across the northern dry-lands.
Despite this asset base, the sector exhibits profound contradictions:
High production, low local consumption: Pastoral zones (North West, North East) hold over 60% of national cattle but have the lowest animal protein consumption (17.8–21.2% of protein from animal sources) and the highest child stunting rates (51.8–53.2%). Livestock products are marketed to southern urban consumers, leaving pastoral households nutritionally deprived.
Limited market integration: Only 36.8% of communities have livestock processing facilities, and milk processing exists in just 1.5% of communities. Nigeria spends $1.2–1.5 billion annually on dairy imports, yet pastoralists produce 90–95% of local milk which is a massive missed opportunity.
Substantial informal trade: Cross-border informal livestock trade is estimated at 60–85% of total trade volumes, meaning pastoral contributions to regional trade and foreign exchange are statistically invisible.
Severe constraints to pastoral welfare: Livestock-related conflict affects 51.3% of communities; desertification affects 57.7% of North East communities; land degradation affects 72.4%. These shocks force distress sales, depress prices, and erode household resilience.
Major data gaps persist: No offtake rates, no price data, no exact informal trade estimates, no productivity metrics, no link between livestock ownership and nutrition outcomes. These gaps constrain evidence-based policy and investment.
6.2 Policy Implications
Based on the evidence presented, the following specific, actionable policy implications are directed at national policymakers (Federal Ministry of Livestock Development, NBS, Federal Ministry of Agriculture and Food Security) and regional bodies (AU-IBAR, ECOWAS).
-
1Implication 1: Formalize Informal Livestock Trade to Make Pastoral Contributions Visible
Evidence: Informal cross-border trade accounts for 60–85% of total livestock trade in West Africa. Eight border states hold over 16 million cattle (>30% of national herd). Pastoral contributions are absent from official statistics.
Actions:
- Conduct border market surveys at Maiadua, Illela, Jibiya, Mfun, Mubi and Gamboru etc within 12 months to establish baseline informal trade volumes and values.
- Establish a trader registration system at major assembly markets to gradually integrate informal actors into formal value chains.
- Include informal trade estimates in NBS foreign trade statistics and balance of payments calculations.
Responsible institutions: NBS, Nigeria Customs Service, FMLD, AU-IBAR, ECOWAS
-
2Implication 2: Build Livestock Processing Infrastructure in Pastoral Zones
Evidence: Only 36.8% of communities have livestock processing; milk processing at 1.5%. Nigeria spends $1.2–1.5 billion annually on dairy imports while pastoralists produce 90–95% of local milk.
Actions:
- Invest in milk collection centres, small-scale pasteurization units, and cheese/yogurt production facilities in North West and North East zones (priority states: Sokoto, Kebbi, Katsina, Jigawa, Borno, Yobe, Taraba, Adamawa).
- Establish slaughterhouses with cold chains and by-product recovery (hides, offal, blood meal) in major pastoral market towns.
- Provide matching grants or low-interest loans to pastoral cooperatives for processing equipment.
Responsible institutions: FMLD, FMARD, Bank of Industry, State governments
-
3Implication 3: Establish a Livestock Price Monitoring and Information System
Evidence: No systematic price data exist. Pastoralists lack market information, leading to exploitation by intermediaries and distress sales.
Actions:
- Establish a monthly price monitoring system at 30–50 key markets (including pastoral assembly markets, border markets, and terminal markets in Lagos, Kano, Abuja, Port Harcourt).
- Publish price bulletins via mobile-based platforms (USSD, SMS) accessible to pastoralists in local languages (Hausa, Fulfulde, Kanuri).
- Integrate price data into the APMD continental dashboard/Data Hub for regional comparison.
Responsible institutions: NBS, FMLD, AU-IBAR, State Ministries of Livestock Development or Agriculture
-
4Implication 4: Integrate Nutrition-Sensitive Interventions into Livestock Market Development
Evidence: Pastoral zones have the highest stunting (53.2% in North West, 51.8% in North East) despite high livestock production. Minimum dietary diversity among children is only 12.4%. Livestock products are sold, not consumed at home.
Actions:
- Require all livestock market development projects to include nutrition-sensitive components : promotion of household milk/meat/egg consumption, nutrition education for pastoral mothers, and women’s empowerment programmess.
- Pilot “milk retention” schemes in pastoral cooperatives, where a fixed percentage of milk production is reserved for household consumption (especially for children under five).
- Integrate child nutrition indicators (stunting, wasting, dietary diversity) into livestock monitoring systems (NASC, LSMS) to track impact.
Responsible institutions: FMLD, Federal Ministry of Health, UNICEF, nutrition development partners
-
5Implication 5: Reduce Conflict Barriers to Market Access
Evidence: Livestock-related conflict affects 51.3% of communities nationally, with rates exceeding 50% in North Central, North West, and South West. Conflict disrupts transhumance routes, increases distress sales, and raises transaction costs.
Actions:
- Accelerate implementation of the National Livestock Transformation Plan (NLTP/NLGAS), focusing on grazing reserves, livestock routes, and conflict resolution mechanisms.
- Establish pastoral peace committees at LGA level in high-conflict states (Benue, Nasarawa, Plateau, Kaduna, Taraba, Adamawa).
- Map and protect priority transhumance corridors using participatory methods with pastoralist associations.
Responsible institutions: FMLD, Federal Ministry of Interior, state governments, Institute for Peace and Conflict Resolution etc
-
6Implication 6: Address Dairy Import Dependency through Domestic Value Chain Development
Evidence: $1.2–1.5 billion annual dairy import bill; local production meets only ~30% of consumption; pastoralists produce 90–95% of local milk but lack access to formal markets.
Actions:
- Launch a National Dairy Development Programme with specific targets: increase local milk collection by 50% within three years; reduce dairy imports by 20% within five years.
- Establish milk collection hubs with cooling tanks in pastoral zones, linked to urban processors (e.g., FrieslandCampina WAMCO, Arla, Chi Limited, Promasidor).
- Provide subsidized veterinary and extension services focused on dairy herd health, mastitis control, and improved feeding.
Responsible institutions: FMLD, FMARD, Nigeria Dairy Development Council (proposed), private sector partners
-
7Implication 7: Fill Priority Data Gaps to Enable Evidence-Based Policy
Evidence: Major data gaps identified in Section 4.4 (offtake rates, productivity metrics, informal trade, wage employment, household income share, nutrition linkages, conflict economics).
Actions:
- Allocate dedicated funding for livestock data collection in the next NBS National Agricultural Sample Census (2027–2028), including productivity modules.
- Conduct a specialized pastoral household survey in 2026–2027 (oversampling North West and North East) to capture income share, off-take, conflict impacts, and nutrition linkages.
- Establish and sustained livestock data working group under the FMLD-NBS-CBN-AU-IBAR partnership to coordinate data collection, harmonize indicators, and populate the APMD continental dashboard.
Responsible institutions: NBS, FMLD,CBN, AU-IBAR, development partners (World Bank, FAO, UNICEF)
6.3 Concluding Statement
Nigeria’s livestock sector holds enormous potential to drive rural economic growth, reduce import dependency, improve food and nutrition security, and enhance household resilience. However, realizing this potential requires confronting the deep contradictions that currently characterize the sector: high production but low local consumption; significant trade but statistical invisibility; large livestock populations but weak processing infrastructure; and substantial employment but poor recognition of pastoral contributions.
The National Livestock Growth Acceleration Strategy (2025–2030) and the African Pastoral Markets Development Platform (APMD) provide the policy frameworks to address these challenges. But success depends on closing the critical data gaps identified in this brief. Without better data on informal trade, productivity, employment, prices, and nutrition linkages, policies will remain blind to pastoral realities, and investments will miss their targets.
The recommendations presented above formalizing informal trade, building processing infrastructure, establishing price monitoring, integrating nutrition into market interventions, reducing conflict barriers, addressing dairy import dependency, and filling priority data gaps offer a practical roadmap. The time to act is now. Nigeria’s pastoralists, livestock sector, and national economy cannot afford another decade of underinvestment and statistical invisibility.
- National Bureau of Statistics (NBS). (2025). Gross Domestic Product Report (Q1–Q4 2025). Abuja: NBS. Available at: www.nigerianstat.gov.ng
- National Bureau of Statistics (NBS). (2023). National Agricultural Sample Census (NASC) 2023 (Fieldwork conducted in 2022; data released in 2023). Abuja: NBS. Available at: https://microdata.nigerianstat.gov.ng
- National Population Commission (NPC) & ICF. (2024). Nigeria Demographic and Health Survey (NDHS) 2023–24 Key Indicators Report. Abuja, Nigeria, and Rockville, Maryland, USA: NPC and ICF. Available at: <https://dhsprogram.com>
- International Institute of Tropical Agriculture (IITA). (2024). National Food Consumption and Micronutrient Survey (NFCMS) 2021 Final Report. Ibadan, Nigeria: IITA. Available at: <https://hdl.handle.net/10568/100010>
- National Bureau of Statistics (NBS). (2010–2018). General Household Survey – Panel (LSMS-ISA). Abuja: NBS. Available at: https://microdata.nigerianstat.gov.ng
- Federal Department of Livestock and Pest Control Services (FDLPCS) / Resource Inventory and Management Limited (RIM). (1992). Resource Inventory and Management (RIMS) Livestock Survey. Abuja: FDLPCS.
- National Agricultural Extension and Research Liaison Services (NAERLS). (2000–2022). Annual Agricultural Performance Survey (APS). Zaria, Nigeria: NAERLS, Ahmadu Bello University.
- National Bureau of Statistics (NBS). (2022). Nigeria Labour Force Survey (NLFS) – Q4 2022 Report. Abuja: NBS. Available at: www.nigerianstat.gov.ng
- Federal Ministry of Livestock Development (FMLD), Department of Ranch and Pastoral Resources Development. (2025). Comprehensive Livestock Market Inventory of Nigeria. Abuja: FMLD.
- National Bureau of Statistics (NBS). (2024). Foreign Trade Statistics (Annual and Quarterly Reports). Abuja: NBS. Available at: www.nigerianstat.gov.ng /elibrary/read/1241511
- United Nations Commodity Trade Statistics Database (UN Comtrade). (2024). Nigeria – Live Animals and Livestock Products Trade Data (HS Codes 01, 02, 41, 43). New York: United Nations Statistics Division. Available at: https://comtrade.un.org
- Trading Economics. (2024). Nigeria – Hides and Skins Exports. Available at: <https://tradingeconomics.com/nigeria/exports>
- EU-Nigeria Agribusiness Platform. (2024). Nigerian Leather and Hides Exports to the European Union (HS 4106). Brussels: European Commission.
- Punch Newspapers. (2026, May). Nigeria’s livestock imports hit N4.46trn in 66 months – NBS. Punch. Available at: https://punchng.com
- OECD/SWAC (Organisation for Economic Co-operation and Development / Sahel and West Africa Club). (2020). Cross-border livestock trade in West Africa: Dynamics and challenges. Paris: OECD Publishing. Available at: <https://www.oecd.org/swac>
- Permanent Interstate Committee for Drought Control in the Sahel (CILSS). (2023). Livestock trade corridors and market integration in West Africa. Ouagadougou: CILSS.
- African Development Bank (AfDB) & National Institute for Animal Science (NIAS). (2021). Livestock Sector Transformation Background Paper – Nigeria. Abidjan: AfDB.
- Federal Ministry of Livestock Development (FMLD). (2025). National Livestock Growth Acceleration Strategy (2025–2030) – Policy Framework. Abuja: FMLD.
- World Bank. (2024). Nigeria Livestock Value Chain Study (unpublished background paper). Washington, DC: World Bank Group.
- Federal Ministry of Agriculture and Rural Development (FMARD). (2016). Agricultural Transformation Agenda Support (ATASP-1) – Livestock Component. Abuja: FMARD.
- Association of Shoes and Leather Goods Manufacturers of Nigeria (ASSOMAC). (2023). Nigeria Leather and Tanneries Industry Report. Lagos: ASSOMAC.
- Spring Journals. (2022). Hides and skins diversion to ponmo consumption in Nigeria: Economic implications. Journal of Agricultural Economics, 18(2), 45–62.
- Food and Agriculture Organisation of the United Nations (FAO). (2018). Chapter 13: Nigeria Livestock Systems. In: Livestock and Livelihoods in West Africa. Rome: FAO. Available at: https://www.fao.org
- Food and Agriculture Organisation of the United Nations (FAO). (2021). Review of Animal and Aquafeed Industries in Nigeria. Rome: FAO.
- One Health and Development Initiative (OHDI). (2023). Livestock Production in Nigeria: Challenges and Opportunities. Ibadan: OHDI.
- Business Post Nigeria. (2025, December). Livestock Contributes 5.8% to Nigeria’s GDP – NBS. Business Post. Available at: https://businesspost.ng
- Independent Newspaper Nigeria. (2024). AfDB Ranching and Livestock Value Chain Initiative Kicks Off in Six States. Independent. Available at: https://independent.ng
- PM News Nigeria. (2024). AfDB Partners Nigeria on Livestock Processing and Value Chains. PM News. Available at: https://pmnewsnigeria.com
- Beam Exchange. (2023). GEMS1 Livestock Feed Finishing : Lessons from Nigeria. Abuja: BEAM Exchange.
- Worldometers. (2025). Nigeria Population. Available at: <https://www.worldometers.info/world-population/nigeria-population>
- Higazi, A. and Yousuf, Z. (2017) Political Unsettlement and Farmer-Pastoralist Conflicts in Nigeria. Conciliation resources/PSRP.
- National Bureau of Statistics (NBS). (2023). National Agricultural Sample Survey (NASS) 2023 – Livestock Population Data. Abuja: NBS. Available at: <https://microdata.nigerianstat.gov.ng/index.php/catalog/173>
- National Bureau of Statistics (NBS). (2019). Nigeria Living Standards Survey (NLSS) 2018/19 – National Poverty Line. Abuja: NBS.
- National Bureau of Statistics (NBS). (2024). General Household Survey–Panel (GHS-Panel) Wave 5, 2023/2024 – Household size. Abuja: NBS.
- National Bureau of Statistics (NBS) / Central Bank of Nigeria (CBN). (2023). Headline Consumer Price Index (CPI) series (2019–2023). Abuja: NBS/CBN.
- Central Bank of Nigeria (CBN). (2023). Official average exchange rate (₦/US$) – 2023. Abuja: CBN.
Methodological notes:
Table A1: Data Sources Used in the Nigeria Livestock Socio-Economic Contribution Brief
| Dataset | Implementing Agency | Coverage | Reference Year(s) | Livestock Variables Captured | Strengths | Key Limitations |
|---|---|---|---|---|---|---|
| National Agricultural Sample Survey (NASS) | National Bureau of Statistics (NBS) and Federal Ministry of Agriculture, FAO, WB | 767 LGAs were covered | 2023 | LIVESTOCK IN STOCK CHANGE IN STOCK- LARGE AND MEDIUM-SIZED ANIMALS CHANGE IN STOCK-POULTRY MILKPRODUCTION EGG PRODUCTION OTHERLIVESTOCKPRODUCTS APIARYPRODUCTION (BEEKEEPING), FISH FARMING/AQUACULTUREPRODUCTION FISH HUNTING/CAPTURE | explicitly designated by NBS as its most comprehensive agricultural dataset after NASC 2023, an exercise designed to provide accurate and up-to-date agricultural statistics | 7 LGAs were excluded due to insecurity, Limited pastoralist representation, other livestock indices not considered including breeds etc |
| National Agricultural Sample Census (NASC) | National Bureau of Statistics (NBS) and Federal Ministry of Agriculture | National (774 LGAs) | 2022–2023 | Livestock population by species, production systems, pastoral households, livestock infrastructure, conflicts, land use, natural resource pressures | Most comprehensive livestock census conducted since 1992; state and LGA-level estimates available, Georeferenced enumeration, Direct field data collection. Inclusion of production systems and pastoral communities. | First comprehensive census in over 30 years; trend analysis limited; some economic variables not collected |
| Annual Agricultural Performance Survey (APS) | National Agricultural Extension and Research Liaison Services (NAERLS) | National | Annual | Livestock population estimates, production indicators, disease outbreaks, sector performance | Captures seasonal agricultural performance. The annual monitoring allows trend analysis and time series | Population estimates largely extrapolated using RIMS growth factors rather than fresh enumeration, Livestock population estimates are largely derived using projected growth rates originating from the RIMS framework. Limited direct enumeration and Less suitable for precise population estimation than NASC |
| Resource Inventory Management Survey (RIMS) | Federal Department of Livestock and Pest Control Services (FDLPCS) | National | 1991–1993 | Livestock population, pastoral mobility, grazing resources, production systems | Only previous national livestock census before NASC | Data now over 30 years old; ecological and demographic conditions have changed significantly, Estimates should be interpreted cautiously when used for contemporary comparisons. |
| National Accounts Statistics | National Bureau of Statistics | National | Annual | Livestock GDP, agriculture GDP, sector contribution to economy | Official GDP estimates used in national planning | Informal livestock activities and ecosystem services largely excluded |
| Nigeria Demographic and Health Survey (NDHS) | NBS / National Population Commission / DHS Programme | National | 2023–2024 | Nutrition, dietary diversity, child malnutrition, household welfare indicators | Nationally representative nutrition dataset | No livestock ownership module; indirect assessment only |
| General Household Survey (GHS-LSMS) | NBS and World Bank | National Panel Survey | Various rounds | Household livestock ownership, income, expenditure, consumption | Links livestock to poverty and livelihoods | Limited pastoralist representation due to mobility |
| National Population Commission Statistics | NPC | National | Various | Population estimates and demographics | Official demographic statistics | Does not capture livestock-related indicators |
| Central Bank of Nigeria (CBN) Statistics | Central Bank of Nigeria | National | Annual | Agricultural financing, livestock investment, trade statistics | Useful for economic and financial analysis | Limited livestock-specific disaggregation |
| Federal Ministry of Livestock Development (FMLD) Reports | FMLD | National | Recent years | Livestock policies, investments, sector development programmes | Current policy context | Administrative data not always nationally representative |
| FAOSTAT | FAO | International/National | Annual | Livestock production, trade, population estimates | Enables international comparison | Often modelled estimates rather than direct enumeration |
| AU-IBAR APMD Data Platforms | AU-IBAR | Continental | Various | Livestock policy, market and pastoralism indicators | Regional comparability | Dependent on national reporting systems |
Methodological Notes on Major Livestock Datasets
1. Livestock Population Trend Analysis
Livestock trend analysis in this brief combines:
- Historical baseline information from RIMS (1992);
- Annual livestock estimates from APS;
- Official livestock census data from NASC (2023).
- Official livestock survey data from NASS (2023).
Because methodologies differ across these datasets, long-term trend analysis should be interpreted as indicative rather than strictly comparable. NASS 2023 is adopted as the current population benchmark in this brief; NASC 2023 remains the reference for sub-national distribution.
Table A2 Scaling Factors Used for Re-basing the Population Series
| Species | NASC 2023 Benchmark (Million) | NASS 2023 Benchmark (Million) | Scaling Factor |
|---|---|---|---|
| Cattle | 58.494 | 54.806 | 0.93695 |
| Goats | 124.072 | 138.948 | 1.11989 |
| Sheep | 63.965 | 64.928 | 1.01505 |
This adjustment preserves the original growth trajectory, annual growth pattern and trend structure while aligning the series with the latest official NASS 2023 population estimates. It should therefore be regarded as a re-based historical series rather than a newly estimated livestock growth model.
2. Key Data Quality Gaps Identified
The review of available datasets revealed persistent gaps in:
- Livestock offtake rates;
- Herd productivity indicators;
- Livestock mortality statistics;
- Household livestock income;
- Value-chain employment;
- Hides and skins production and utilisation;
- Domestic and cross-border livestock trade volumes;
- Livestock consumption and nutrition linkages;
- Climate shock impacts on livestock assets;
- Gender-disaggregated livestock ownership;
- Pastoral mobility tracking.
These gaps informed the recommendations for strengthening the National Animal Identification and Traceability System (NAITS) and future livestock data collection efforts in Nigeria.
nutrition indicators;
Methodological Note: Derivation of Average Household Income Estimate
Purpose: To provide a reference household income figure for contextualising the contribution of livestock to household livelihoods in Nigeria.
Table A4 Data Sources for Household Income Estimate:
| Source | Data | Year |
|---|---|---|
| National Bureau of Statistics (NBS) | Nigeria Living Standards Survey (NLSS) 2018/19 – National poverty line | 2018/19 |
| NBS / Central Bank of Nigeria (CBN) | Headline Consumer Price Index (CPI) series | 2019–2023 |
| NBS | General Household Survey–Panel (GHS-Panel) Wave 5 – Average household size | 2023/24 |
| Central Bank of Nigeria (CBN) | Official average exchange rate | 2023 |
Calculation Steps:
Baseline: ₦137,430 per person per year (NLSS 2018/19 national poverty line).
Inflation adjustment: Cumulative CPI multiplier from 2019 to 2023 = 2.19×. ₦137,430 × 2.19 = ₦300,972 per person per year (2023 terms).
Household size adjustment: Average household size = 5.6 persons. ₦300,972 × 5.6 = ₦1,685,443 per household per year.
Monthly income: ₦1,685,443 ÷ 12 = ₦140,454 per month.
USD conversion: ₦140,454 ÷ ₦634.16 = USD 221 per month.
Rounded: USD 200 per month.
Limitations and Transparency Statement:
- This is an author-constructed estimate, not an official NBS, CBN, or World Bank published figure.
- No single Nigerian government or multilateral source publishes an aggregate "average household income" statistic.
- The estimate is derived from the national poverty line (a welfare threshold), not a direct measure of average income. Actual household incomes vary considerably across zones, urban/rural areas, and production systems.
- The inflation adjustment uses the headline CPI; food and non-food inflation rates differ, and the CPI basket may not perfectly reflect the consumption patterns of pastoral households.
- The exchange rate used is the CBN official rate; parallel market rates differ significantly and would yield a lower USD equivalent.
Table A5 Child Undernutrition: National Overview
| Indicator | % below -2 SD (Moderate/Severe) | % below -3 SD (Severe) | Mean z-score |
|---|---|---|---|
| Stunting (Height-for-age, chronic malnutrition) | 39.5% | 18.4% | -1.6 |
| Wasting (Weight-for-height, acute malnutrition) | 8.4% | 1.8% | -0.5 |
| Underweight (Weight-for-age, composite) | 26.6% | 8.3% | -1.3 |
Trend (2018 to 2023–24): Stunting increased from 37% to 40%, wasting from 7% to 8%, underweight from 22% to 27%. This worsening trend coincides with rising insecurity, desertification, and economic pressures on pastoral and agropastoral systems.
Geographic Variation: Livestock Zones and Child Nutrition
The NDHS data show stark regional disparities that align closely with livestock production systems and pastoral concentration.
Table A6 Geographic Variation: Livestock Zones and Child Nutrition
| Zone | Stunting (%) | Wasting (%) | Underweight (%) | Livestock System | Interpretation |
|---|---|---|---|---|---|
| North West | 53.2% (highest) | 8.3% | 33.8% (highest) | Extensive pastoral (70–80% of national cattle) | Highest chronic malnutrition – despite high ruminant populations, children are most stunted. Suggests poor access to animal-source foods (ASF) within pastoral households, possibly due to market integration failures, conflict, or milk not reaching young children. |
| North East | 51.8% | 8.1% | 33.4% | Pastoral + transhumant | Second highest stunting. Conflict (Boko Haram, farmer-herder) and desertification likely disrupt both livestock production and child feeding. |
| North Central | 36.8% | 6.5% | 21.1% | Mixed crop-livestock, agro-pastoral | Moderate stunting. Better integration of crops and livestock may improve household food security. |
| South West | 21.2% | 11.0% | 21.8% | Peri-urban intensive | Lowest stunting but highest wasting (acute malnutrition). Wasting (11.0%) is concerning; possibly due to illness or poor dietary diversity despite better economic status. |
| South East | 20.6% | 7.0% | 16.0% | Small ruminant | Low stunting, moderate wasting. |
| South South | 17.9% (lowest) | 11.3% (highest) | 16.8% | Mixed smallholder | Lowest stunting but highest wasting (11.3%). Suggests acute malnutrition may be driven by factors other than livestock availability (e.g., child illness, poor feeding practices). |
Critical Finding: The North West and North East zones – which host the highest ruminant livestock populations (17.86M and 17.99M cattle respectively) and where pastoral systems dominate – have the highest stunting rates (53% and 52%) in the country. This paradox suggests that livestock ownership at the community level does not automatically translate into improved child nutrition. Possible explanations include:
- Livestock products (milk, meat) are sold for cash rather than consumed by children (market integration without nutrition-sensitive programming).
- Conflict and mobility disrupt household stability and child feeding practices.
- Gender dynamics: Women may have limited control over livestock-derived income or milk allocation.
- Lack of nutrition education on appropriate child feeding with animal-source foods.
Infant and Young Child Feeding (IYCF) Indicators
Table A7 The NDHS 2023–24 provides critical insights into whether young children actually consume animal-source foods.
| Indicator | National (%) | Denominator | Relevance to Livestock |
|---|---|---|---|
| Early initiation of breastfeeding (within 1 hour of birth) | 35.5% | Children born in last 2 years (n=11,407) | Low – missed opportunity for colostrum (passive immunity, nutrients) |
| Exclusive breastfeeding under 6 months | 28.8% | Children 0–5 months (n=2,734) | Very low – only 1 in 3 infants exclusively breastfed |
| Minimum dietary diversity (MDD) 6–23 months (≥5 out of 8 food groups) | 12.4% | Children 6–23 months (n=7,611) | Extremely low – MDD includes meat, eggs, dairy as key food groups |
| Sweet beverage consumption 6–23 months | 41.2% | Same | High – displaces nutrient-dense foods |
| Unhealthy food consumption 6–23 months | 23.7% | Same | High – further displaces ASF |
MDD (12.4%) means that only about 1 in 8 children aged 6–23 months consumes a diverse diet that would typically include animal-source foods (ASF). This is a direct indicator of inadequate access to or consumption of meat, milk, and eggs – despite Nigeria’s large livestock population.
No zone-level MDD data was provided in the extracted tables, but given the strong correlation between stunting and livestock zones, it is likely that MDD is lowest in North West and North East.
Per Capita Consumption of Animal-Source Foods (ASF)
Direct per capita consumption data (meat, milk, eggs) is not available in the NDHS or NASC, APS etc datasets. The NDHS collects dietary diversity at the child level (MDD) but not household-level ASF consumption quantities.
Proxy evidence from NDHS MDD: Only 12.4% of children 6–23 months achieve minimum dietary diversity, which requires consumption of at least one ASF group (meat/fish, eggs, or dairy). This implies that the vast majority of young children do not regularly consume animal-source foods – a major concern given Nigeria’s large livestock population.
Table A8 Share of protein from animal sources across regions of Nigeria:
| Geopolitical Zone | Protein Source | Mean (g) | % of Total Nutrient Intake |
|---|---|---|---|
| North Central | Beef | 2.3 | 5.4 |
| North Central | Catfish | 1.2 | 3 |
| North Central | Tilapia fish | 1.2 | 2.8 |
| North East | Beef | 1.4 | 3.3 |
| North East | Cowpea products | Data not livestock | Data not livestock |
| North West | Fura da nono (milk/cereal mix) | 3.5 | 7.1 |
| North West | Beef | Data not in top 10 | Data not in top 10 |
| South East | Beef | 3.6 | 7.1 |
| South East | Shellfish | 2.9 | 5.8 |
| South East | Mackerel fish | 2.6 | 5 |
| South East | Stockfish fish | 1.3 | 2.6 |
| South South | Beef | 4.5 | 9 |
| South South | Mackerel fish | 3.2 | 6.3 |
| South South | Catfish | 2.9 | 5.8 |
| South South | Shellfish | 2.8 | 5.6 |
| South South | Tilapia fish | 1.4 | 2.7 |
| South West | Hake fish | 4.5 | 8.3 |
| South West | Beef | 2.9 | 5.5 |
| South West | Sardine fish | 2.9 | 5.4 |
| South West | Mackerel fish | 2.6 | 4.9 |
Key Findings:
- Child undernutrition is alarmingly high and worsening: Stunting increased from 37% (2018) to 40% (2023–24); underweight from 22% to 27%.
- Pastoral zones have the worst nutrition outcomes: North West (53.2% stunting) and North East (51.8%) – the centres of Nigeria’s ruminant livestock production – have the highest chronic malnutrition rates in the country.
- Minimum dietary diversity among young children is only 12.4% – meaning very few children consume a diverse diet that would include animal-source foods (meat, eggs, dairy). This is a direct indicator of poor access to or utilisation of livestock products for child nutrition.
- Wealth and education are strong predictors: Children in the lowest wealth quintile (where many pastoral households fall) have 55.9% stunting vs. 14.7% in the highest quintile. Children of mothers with no education have 55.1% stunting vs. 14.0% for those with post-secondary education.
- Livestock ownership alone is insufficient to improve nutrition: Despite high livestock densities, pastoral zones have the worst nutrition outcomes. This suggests that market integration, conflict, gender dynamics, and lack of nutrition education prevent livestock assets from translating into improved child feeding.
Policy Implications (Supplemental for Section 5)
Nutrition-sensitive livestock interventions are urgently needed in North West and North East, including:
- Promoting household consumption of milk, meat, and eggs alongside commercial sales.
- Nutrition education for pastoral mothers on child feeding with animal-source foods.
- Women’s empowerment programmess to give women control over livestock-derived income and milk allocation.
- Address conflict and market access in pastoral zones so that livestock products reach vulnerable household members, not just markets.
- Integrate child nutrition indicators into livestock monitoring systems (e.g., NASC, LSMS) to track the impact of livestock interventions on stunting, wasting, and dietary diversity.
Table A9 Data Gaps Specific to Nutrition (Supplemental to Section 4)
| Gap | Impact | Recommended Action |
|---|---|---|
| No household-level ASF consumption data (meat, milk, eggs in kg/year or frequency) | Cannot quantify livestock’s contribution to dietary intake or protein supply. | Add ASF consumption module to next LSMS/GHS round (7-day recall for meat, milk, eggs). |
| No link between livestock ownership and child nutrition in nationally representative survey | Cannot demonstrate causal impact of livestock interventions on stunting/wasting. | Ensure next NDHS or LSMS includes both livestock asset modules (species, number owned, milk production) and child anthropometry. |
| No zone-level minimum dietary diversity (MDD) data in extracted NDHS tables | Cannot identify which zones have the worst child feeding practices. | Request zone-level MDD tabulations from NDHS 2023–24. |
| No per capita protein share from animal sources | Weakens advocacy for livestock’s role in nutrition security. | Conduct a dedicated dietary survey in pastoral and mixed systems. |
Trade corridor mapping;
Figure A2 Map of Nigeria showing stock route
Source: Higazi and Yousuf (2017).
Figure A3 Map of Nigeria showing trade corridors relation to high livestock production corridors
Figure A4 Map of Nigeria showing internal livestock trade corridors