


The Federal Democratic Republic of Ethiopia (hereafter 'Ethiopia') covers approximately 1.1 million square kilometers with diverse agro-ecological zones ranging from humid highlands to arid and semi-arid lowlands. The country has a rapidly growing population and an economy historically dominated by agriculture. Agriculture remains the backbone of the Ethiopian economy, contributing significantly to GDP, employment, export earnings, and food security. Major agricultural activities include crop production, livestock rearing, forestry, and fisheries.
Agriculture contributing approximately 32.1% to 36% of the national Gross Domestic Product (GDP) according to data from (The World Bank) and the (African Development Bank Group), Development Partners. The sector is the nation's primary employment engine, engaging between 67% and 80% of the total workforce as modeled by the International Labour Organization (ILO) and reported by the World Bank Africa division. The Government of Ethiopia (GoE) has implemented a series of policies and strategies aimed at advancing agricultural and livestock development. These initiatives are part of the broader objective to eradicate poverty and shift towards middle-income status, a target originally set for 2025. The national development plans (NDPs) emphasize export-led growth as a key driver for rural development and transformation. Significant progress in the livestock sector has resulted from the NDPs, which have facilitated improved extension services, increased financial support, market liberalization, and established a more enabling macroeconomic environment. Moreover, these development plans have provided the foundation for the creation of a Livestock Master Plan (LMP).
Agriculture forms the cornerstone of the Ethiopian economy, serving as its primary engine for growth, employment, and trade. To provide a concise, non-contradictory overview of the sector, data is reconciled using standard national accounts alongside official baseline metrics from the Food and Agriculture Organization (FAO) and the Federal Democratic Republic of Ethiopia Ministry of Agriculture.
The livestock sector represents a primary structural core of Ethiopia's agricultural framework. Nationally, the animal resource base serves as an immense asset pool driving macroeconomic indicators. To properly contextualize its weight within national accounts, the explicit financial shares and baseline structural parameters are organized below.
| Indicator | Value | Year | Official Source |
|---|---|---|---|
| National GDP (current USD) | USD 149.74 billion | 2024 | World Bank WDI (NY.GDP.MKTP.CD) |
| Agriculture % of GDP | 34.9% | 2024 | World Bank |
| Livestock % of GDP | 7.5% | 2023 | FAO / Ministry of Agriculture estimates |
| Livestock % of Ag GDP | 35% | 2023 | ILRI / FAO estimates |
| Livestock GDP (current USD) | Approx. USD 11.7 billion | 2024 | World Bank WDI; FAO / Ministry of Agriculture estimates |
| Total Cattle Population | 70.3 million | 2023 | CSA Agricultural Sample Survey |
| Total Sheep Population | 42.9 million | 2023 | CSA Agricultural Sample Survey |
| Total Goat Population | 52.5 million | 2023 | CSA Agricultural Sample Survey |
| Total Camel Population | 8.1 million | 2023 | CSA Agricultural Sample Survey |
| Pastoral/Pastoralist Population | 12–15 million people | 2023 | Ministry of Agriculture / IGAD |
| % of Population Pastoral | 10–12% | 2023 | Ministry of Agriculture / IGAD |
| Source: values and Official Source attributions as stated in the canonical Table 1 (Country Livestock Snapshot). | |||
| Species Type | Population Count | Reference Survey Base | Primary Production Focus Zone |
|---|---|---|---|
| Cattle | 70.3 Million | 2023 CSA Survey | Highland Mixed Farms & Lowland Valleys |
| Sheep | 42.9 Million | 2023 CSA Survey | Highland Sub-Alpin Areas & Semi-Arid Plains |
| Goats | 52.5 Million | 2023 CSA Survey | Arid & Semi-Arid Lowland Rangelands |
| Camels | 8.1 Million | 2023 CSA Survey | Arid Lowlands (Somali, Afar, Borena) |
| Reference survey base: 2023 CSA Agricultural Sample Survey (tabulated alongside Table 1 in the canonical brief). | |||
Methodological Concerns: It is structurally important to note that the annual CSA Agricultural Sample Surveys rely primarily on sampling frameworks designed for sedentary agricultural holdings. Consequently, highly mobile nomadic herds moving across remote border corridors are often under-represented. The actual livestock population within pure pastoral zones is widely recognized by sector experts to exceed formal survey benchmarks.
As summarized in Table 1, the livestock sector officially accounts for 7.5% of total national GDP and approximately 35% of agricultural GDP. When the non-monetized contributions of livestock such as organic soil fertilization and draught power for highland cereal production are factored into expanded national satellite accounts, the sector's real integrated contribution is substantially higher, demonstrating its foundational role in national economic stability.
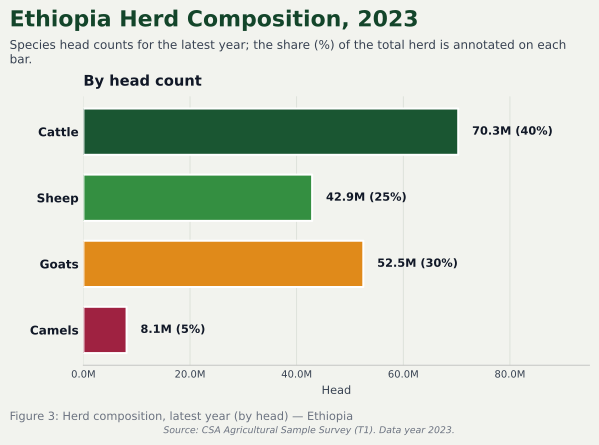
Ethiopia possesses a large and diverse livestock population, comprising cattle, sheep, goats, camels, and equines distributed across diverse agro-ecological zones. The sector contributes significantly to agricultural Gross Domestic Product (GDP), employment generation, household income, and resilience-building among rural populations, particularly within pastoral and agro-pastoral production systems.
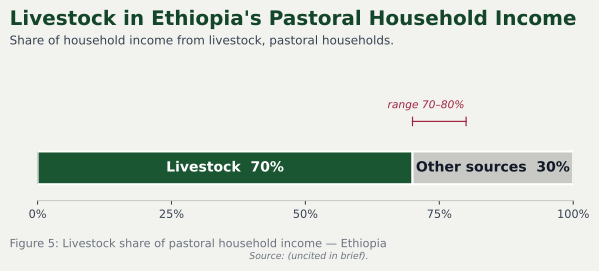
Within pastoral communities, livestock is the primary driver of the local economy, generating over 70% to 80% of total annual household income. This income is generated through the sale of live animals, fluid raw milk, and primary processing by-products like hides and skins.
| Livelihood Income Category | Percentage Contribution to Income | Primary Seasonal Drivers | Risk Profile |
|---|---|---|---|
| Live Animal Commercial Sales | 55% – 65% | Dry season pressures, festive high demand | Highly volatile prices |
| Milk & Dairy By-products Trade | 15% – 20% | Wet season flush, calving intervals | High perishability |
| Dryland Crop Production | 5% – 10% | Opportunistic flooding, erratic rain | Extreme crop failure risk |
| Informal Labor & Charcoal Trade | 5% – 10% | Off-season coping mechanism | Land degradation impacts |
| Source: canonical Table 4 — Household Income Sources in Pastoral Areas. | |||
Beyond direct monetary income, livestock functions as a key non-monetary asset. Animals serve as a primary savings mechanism and self-insurance asset against crop failures. In addition, livestock plays an important role in cultural networks, where it is used for social insurance transfers and bride wealth (dowry) payments that reinforce communal security.
The livestock sector serves as an important regional source of employment. Beyond direct pastoral herding, the broader value chain supports jobs in animal transportation networks, feed production and processing, private and public veterinary services, urban butcher operations, and industrial leather tanneries, creating valuable economic linkages across rural and urban areas.
In arid and semi-arid environments, livestock holdings serve as a critical asset buffer against climate-induced risks. When rainfall drops and crops fail, pastoral and agro-pastoral households manage consumption needs by selling small ruminants to purchase grain, helping stabilize household food availability.
However, the sector faces ongoing exposure to major production constraints and shocks. Recurrent droughts, resource conflicts over declining rangeland borders, and transboundary animal diseases such as Peste des Petits Ruminants (PPR) and Foot and Mouth Disease (FMD) can cause significant herd losses, which impacts household food security.
| Core Constraint Category | Specific Structural Bottleneck Description | Impact Severity Level | Strategic Policy Recovery Action |
|---|---|---|---|
| Feed and Water Scarcity | Climate-driven degradation of rangelands, dried water points | Critical / High | Rehabilitate deep water wells, protect mobility tracks |
| Animal Disease Shocks | Recurrent outbreaks of transboundary diseases (PPR, FMD, CBPP) | High / Widespread | Expand cold-chain mobile vaccination programs |
| Infrastructure Deficits | Missing market holding structures, bad roads, long trekking routes | Moderate / High | Build regional livestock markets & holding pens |
| Institutional & Credit Gaps | Lack of tailored financial services and credit for pastoralists | Moderate | Design mobile, sharia-compliant banking programs |
| Source: canonical Table 6 — Major Constraints Affecting Livestock Production. | |||
The econometric estimation of the household welfare model indicates a statistically significant positive relationship between herd size (measured in Tropical Livestock Units) and annual household income. Conversely, physical distance to formal market hubs exhibits a significant negative coefficient, confirming that high transaction costs and long travel distances reduce net producer returns.
In terms of nutrition, direct access to livestock assets correlates with better childhood health outcomes. Households that maintain active milking herds are able to provide consistent access to animal-source proteins and essential micronutrients, helping lower stunting and wasting indicators among children in pastoral areas. Per-capita meat supply is 6.91 kg/capita/yr.2 (² FAO Food Balance Sheets, Ethiopia, 2023 — food supply quantity, kg/capita/yr, item 'Meat'; supply basis.)
The domestic livestock marketing framework operates through a network of primary collection points, secondary regional markets, and terminal urban consumption hubs. The primary value chain actors include pastoral producers, local market scouts, small-scale collectors, specialized animal fattening operations, wholesale traders, and urban meat processors or municipal butchers.
The operational efficiency of these channels is limited by significant infrastructural constraints. Many primary and secondary markets lack basic holding infrastructure, such as secure loading ramps, reliable stock watering points, and veterinary diagnostic checkpoints. Furthermore, because specialized livestock transport vehicles are limited, animals are frequently trekked over long distances on foot. This leads to substantial weight loss, animal fatigue, and reduced market value by the time the stock arrives at terminal urban markets.

Ethiopia's international trade performance includes two distinct sub-sectors: the formal export of chilled small ruminant meat and live animals primarily to the Middle East and North Africa (MENA) markets, and a substantial informal cross-border trade network that operates across the Horn of Africa.
| Trade Flow Category | Value (USD Millions) | Export Year Base | Formality Protocol | Key Destination Partners | Official Primary Data Source |
|---|---|---|---|---|---|
| Live Animal Exports | 44.17 | 2020/21 | Formal Track | Somalia, Sudan, Djibouti, Oman, KSA, Egypt | Ethiopian Customs Commission |
| Live Animal Exports | 28.28 | 2021/22 | Formal Track | Somalia, Sudan, Djibouti, Oman, KSA, Egypt | Ethiopian Customs Commission |
| Live Animal Exports | 16.00 | 2022/23 | Formal Track | Somalia, Sudan, Djibouti, Oman, KSA, Egypt | Ethiopian Customs Commission |
| Live Animal Exports | 19.70 | 2023/24 | Formal Track | Somalia, Sudan, Djibouti, Oman, KSA, Egypt | Ethiopian Customs Commission |
| Live Animal Exports | 63.30 | 2024/25 | Formal Track | Somalia, Sudan, Djibouti, Oman, KSA, Egypt | Ethiopian Customs Commission |
| Meat Exports | 78.50 | 2021/22 | Formal Track | United Arab Emirates, Oman, Saudi Arabia | Ethiopian Customs Commission |
| Meat Exports | 89.27 | 2022/23 | Formal Track | United Arab Emirates, Oman, Saudi Arabia | Ethiopian Customs Commission |
| Meat Exports | 78.59 | 2023/24 | Formal Track | United Arab Emirates, Oman, Saudi Arabia | Ethiopian Customs Commission |
| Meat Exports | 112.00 | 2024/25 | Formal Track | United Arab Emirates, Oman, Saudi Arabia | Ethiopian Customs Commission |
| Hides/Skins Exports | 20.28 | 2023 | Formal Track | China, Germany, Netherlands, Sweden, Turkey | UN COMTRADE / Trading Economics |
| Informal Exports | Significant (approx 43% share) | 2024 | Informal Track | Somalia, Kenya, Sudan, Djibouti | Int. Journal of Business & Econ. |
| Live Animal Imports | 7.36 | 2023 | Formal Track | Netherlands, UAE, South Africa | UN COMTRADE / Trading Economics |
| Meat Imports | Minimal Volume | 2023 | Formal Track | UAE, South Africa, European Union | UN COMTRADE Registry |
| Source: values and Official Primary Data Source attributions as stated in the canonical Table 5 (Livestock Trade Summary). | |||||
Analysis of Trade Discrepancies: The formal live animal export values show notable shifts, dropping to $16 million in 2022/23 before recovering to $63.3 million in 2024/25. This pattern does not indicate a drop in regional demand, but rather highlights the resilience of informal cross-border trade networks. Pastoral producers often route commercial stock through informal channels into neighboring countries to bypass complex export licensing procedures and secure direct access to foreign currency.
Market integration has a complex effect on pastoral communities. Well-structured market integration allows pastoralists to regularize income streams, move away from subsistence production, and invest in animal health services and quality feed inputs, which helps stabilize household purchasing power during seasonal shocks.
However, many communities continue to face significant barriers to effective market integration. High transaction costs, lack of formal credit facilities, and limited market transparent pricing mechanisms reduce producers' margins. Because informal cross-border trade is largely excluded from official GDP calculations, pastoral contributions receive limited policy attention, leading to under-investment in public infrastructure for dryland regions. Furthermore, price volatility within domestic markets leaves pastoral households exposed to sudden shifts in grain-to-livestock terms of trade during major drought events.
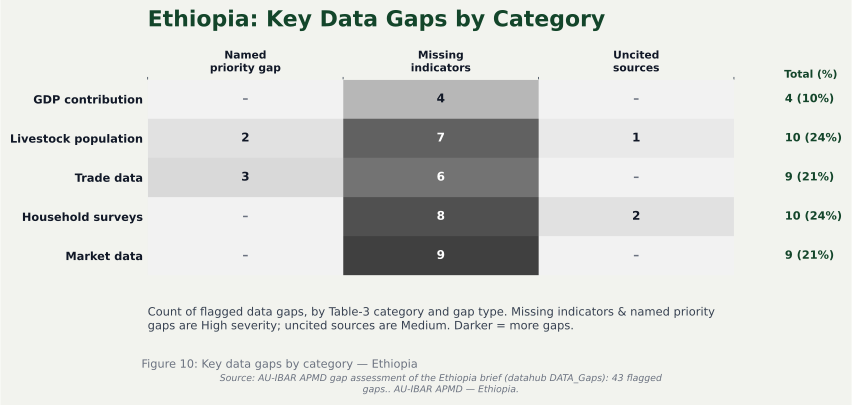
The structural analysis of Ethiopia's livestock sector is limited by systematic data gaps that undervalue the sector's contribution and affect long-term policy formulation. Table 7 compiles these critical limitations and suggests targeted actions.
| Data Category | Gap Description | Impact on Recognition | Possible Action |
|---|---|---|---|
| GDP Contribution | National accounts often undervalue pastoral livestock production and non-market ecosystem services. Informal livestock trade is largely excluded from GDP calculations. | Underestimates pastoral contribution to the national economy and reduces policy attention and budget allocation. | Develop satellite accounts for pastoral economies and integrate informal livestock trade estimates into GDP calculations. |
| Livestock Population | Livestock census systems are irregular and often fail to capture mobile herds in remote pastoral areas. Seasonal mobility complicates enumeration. | Leads to inaccurate livestock population estimates and weak planning for animal health, feed, and marketing infrastructure. | Use geospatial technologies, mobile data collection, and periodic pastoral-specific livestock surveys. |
| Trade Data | Large volumes of informal cross-border livestock trade remain undocumented. Border monitoring systems are weak. | Actual export volumes and foreign exchange contributions are underestimated. | Strengthen border surveillance, simplify formal export procedures, and incorporate informal trade monitoring systems. |
| Household Surveys | National household surveys are often designed for sedentary agricultural systems and inadequately capture pastoral mobility, herd dynamics, and seasonal income patterns. | Poverty, income, nutrition, and livelihood indicators for pastoralists are often inaccurate or incomplete. | Design pastoral-sensitive survey methodologies with seasonal and mobility-adjusted sampling approaches. |
| Market Data | Limited real-time livestock market information on prices, volumes, animal quality, and trade flows. Market data coverage is uneven across pastoral regions. | Reduces market transparency and weakens evidence-based policy and investment decisions. | Establish integrated livestock market information systems using mobile apps and SMS broadcasts. |
| Source: canonical Table 7 — Structural Analysis of Data Gaps. | |||
The findings of this report demonstrate that Ethiopia's livestock sector possesses substantial untapped economic potential despite persistent structural and institutional constraints. Livestock remains central to household livelihoods, national economic performance, employment generation, and resilience-building within pastoral and agro-pastoral systems. However, low productivity, weak market integration, inadequate infrastructure, and fragmented institutional support continue to constrain the sector's overall performance.
The enhanced analysis confirms that sustainable transformation of the livestock sector requires integrated interventions that simultaneously address production systems, market structures, service delivery, trade formalization, and value addition. Future policy frameworks should prioritize climate-resilient livestock systems, inclusive market development, producer empowerment, and investments in veterinary services and processing infrastructure. Strengthening institutional coordination and evidence-based policy making will be essential to unlocking the full developmental potential of Ethiopia's livestock economy.
The findings of this study reveal a fundamental structural contradiction within Ethiopia's livestock sector: while the country possesses a large and diverse livestock resource, the economic returns generated from this resource remain disproportionately low. This paradox reflects deep-rooted inefficiencies across production systems, market structures, and institutional arrangements, indicating that the core challenge is not resource scarcity but systemic under performance.
A critical issue emerging from the analysis is the productivity gap across production systems. Pastoral and agro-pastoral systems hold a substantial share of national livestock assets, yet they exhibit persistently low output per animal. This is not merely a technical constraint but a reflection of broader systemic failures, including weak extension services, constrained access to improved breeds, and under investment in animal health systems. While national policies such as the Livestock Master Plan emphasize productivity enhancement, implementation remains uneven and insufficiently adapted to the realities of extensive pastoral systems. In particular, productivity interventions have often been designed with sedentary, mixed farming systems in mind, limiting their effectiveness in mobile pastoral contexts.
The analysis further underscores the structural inefficiencies within livestock value chains, where market participation is high but value capture by producers is low. The dominance of intermediaries and the absence of strong producer organizations result in an unequal distribution of benefits, with pastoralists receiving a disproportionately small share of final market value. This reflects a classic case of weak vertical coordination and constrained bargaining power at the producer level. Moreover, the prevalence of informal trade networks, while providing flexibility and market access, undermines formal market development, reduces government revenue, and limits quality control and standardization. Policy efforts to formalize trade have so far yielded constrained success, largely because they have not adequately accounted for the economic incentives and adaptive strategies of pastoral actors.
Another key issue is the disconnect between livestock production and market systems. This study demonstrates that livestock producers are relatively market-aware, yet their participation remains confined to local and low-value markets. This indicates that the primary constraint is not lack of willingness to engage with markets but rather structural barriers such as poor infrastructure, high transaction costs, and constrained access to reliable market information. The negative relationship between market distance and household income, as demonstrated in the econometric results, reinforces the critical importance of spatial factors in shaping economic outcomes. Nevertheless, current policy interventions have not sufficiently prioritized the development of market infrastructure along key livestock corridors, resulting in persistent inefficiencies.
The role of livestock as a risk management and financial asset also introduces strategically important policy considerations. Pastoral households tend to prioritize herd accumulation over market-oriented production, leading to low offtake rates. While this behavior is often interpreted as resistance to commercialization, the findings suggest that it is a rational response to high levels of environmental and market uncertainty. In the absence of reliable insurance mechanisms, financial services, and stable markets, livestock serves as a form of self-insurance. This implies that efforts to increase commercialization without addressing underlying risks may be ineffective or even counterproductive. Policies must therefore shift from simply promoting market participation to creating an enabling environment that reduces risk and enhances resilience.
This study also reveals substantial institutional and service delivery gaps, particularly in veterinary and extension systems. Access to veterinary services is shown to have a strong positive impact on household income, yet service coverage remains constrained, especially in remote pastoral areas. This reflects both capacity constraints and institutional fragmentation, where responsibilities are dispersed across multiple agencies with constrained coordination. Similarly, extension services often fail to reach pastoral communities effectively, either due to mobility constraints or because extension models are not tailored to pastoral production systems. These gaps highlight the need for more adaptive and decentralized service delivery approaches.
From a broader development perspective, the livestock sector illustrates a case of missed opportunities in value addition and export diversification. Ethiopia continues to rely heavily on live animal exports, which capture substantially less value compared to processed meat and dairy products. This pattern reflects constrained investment in agro-processing infrastructure, weak compliance with international standards, and insufficient integration into global value chains. While policy frameworks emphasize export-led growth, the lack of alignment between production systems, processing capacity, and market requirements constrains progress. Without addressing these structural bottlenecks, the sector will continue to underperform in terms of foreign exchange generation.
Policy Implications and Strategic Recommendations
The findings suggest that incremental improvements will be insufficient to transform the livestock sector. Instead, a systemic and integrated policy approach is required, focusing on the following strategic areas:
-
1First, productivity enhancement must move beyond conventional approaches and adopt system-specific strategies. In pastoral areas, this requires investment in mobile veterinary services, climate-resilient feed systems, and adaptive breeding programs rather than reliance on high-input, sedentary production models. Improving productivity is not simply a technical issue but one that requires aligning interventions with the ecological and socio-economic realities of pastoral systems.
-
2Second, market system development should prioritize value chain integration and producer empowerment. Strengthening producer organizations and cooperatives can improve bargaining power and reduce the dominance of intermediaries. At the same time, investments in market infrastructure, including roads, holding grounds, and quarantine facilities, are essential to reduce transaction costs and improve access to higher-value markets.
-
3Third, trade formalization strategies must be incentive-based rather than regulatory-driven. Informal trade persists because it is more efficient and accessible for pastoralists. Therefore, policies should focus on making formal markets more competitive by reducing costs, simplifying procedures, and improving services, rather than attempting to restrict informal channels.
-
4Fourth, risk management systems need to be strengthened to support commercialization. Expanding access to livestock insurance, financial services, and early warning systems can reduce the need for herd accumulation as a coping strategy and encourage greater market participation. Without addressing risk, efforts to increase offtake rates are unlikely to succeed.
-
5Fifth, institutional coordination and service delivery must be improved. This includes strengthening veterinary and extension systems, enhancing coordination among government agencies, and leveraging public-private partnerships to expand service coverage. Decentralized and community-based approaches may be particularly effective in pastoral areas.
-
6Finally, value addition and export diversification should be prioritized as a long-term strategy. Investments in meat processing, cold chain infrastructure, and quality certification systems can enable Ethiopia to move up the value chain and capture greater economic benefits from its livestock resources.
- African Union - InterAfrican Bureau for Animal Resources (AU-IBAR), 2023. Pastoralism and Regional Livestock Trade Policy Framework. Nairobi, Kenya.
- Central Statistical Agency (CSA), 2023. Agricultural Sample Survey: Volume II - Report on Livestock and Livestock Characteristics. Addis Ababa, Ethiopia.
- Federal Democratic Republic of Ethiopia Ministry of Agriculture (MoA), 2021. Ethiopia Livestock Master Plan (LMP) - Key Findings and Recommendations. Addis Ababa, Ethiopia.
- Food and Agriculture Organization (FAO), 2024. The Status of Animal Genetic Resources and Livestock Livelihoods in the Horn of Africa. Rome, Italy.
- International Livestock Research Institute (ILRI), 2022. Socio-economic value chain analysis of live animal and meat exports from Ethiopia. Study Brief, Nairobi, Kenya.
- World Bank, 2024. Ethiopia Economic Update: Accelerating Agricultural and Livestock Transformation for Sustainable Growth. Washington, D.C.
General Objective
To comprehensively analyze the socio-economic contribution of the livestock sector to the broader Ethiopian economy, with a specific, dedicated analysis of the structural performance, barriers, and dynamics within pastoral and agro-pastoral production systems.
Specific Objectives
- To quantify the exact direct and indirect contributions of livestock resources to national GDP, rural employment frameworks, and household income portfolios.
- To map out domestic marketing channels and systematically evaluate formal versus informal cross-border market flows.
- To evaluate the role of livestock assets as a buffer for food security and asset-based resilience within fragile dryland zones.
- To identify persistent data measurement gaps and provide empirical recommendations for the African Pastoral Markets Development Platform (APMD).
Study Questions
- What is the empirical contribution of pastoral and agro-pastoral systems to Ethiopia's national accounts and rural workforce absorption?
- How do domestic value chain blockages and informal cross-border marketing pathways shape producer prices?
- In what ways do livestock assets safeguard household dietary needs and cushion communities against extreme climate shocks?
Existing empirical studies from ILRI, FAO, and regional bodies confirm that standard national accounting models frequently understate the livestock sector's true economic weight. While direct values like commercial meat and milk sales are captured, the immense non-market contributions—such as ox-plow draft power, organic manure recycling, and the massive, unrecorded informal cross-border trade—are rarely fully captured in official national GDP accounts.
A significant gap persists in matching large-scale trade performance tracking with localized household food security and asset buffer measurements within pastoral borderlands. This report addresses this gap by directly linking macro-level trade trends with the socioeconomic variables that shape household-level vulnerability and market access.
This study is anchored in the Sustainable Livelihoods Framework (SLF) and the concepts of New Institutional Economics (NIE). Under the SLF approach, livestock is evaluated not merely as an agricultural output, but as a core financial, natural, and social capital asset that shapes the adaptive capacities of rural households. NIE complements this by highlighting how structural transaction costs, uncoordinated market regulations, and infrastructure gaps influence trade decisions within pastoral production environments.
The conceptual framework operates on the premise that macro-economic indicators (national accounts, trade balances) and micro-level parameters (household income, nutritional stability) are driven by the direct relationship between Livestock Assets and Market Access Pathways, working within an environment exposed to recurrent climate shocks, animal disease vectors, and shifting policy environments.
┌────────────────────────────────────────────────────────┐
│   VULNERABILITY CONTEXT                                │
│   (Recurrent Droughts, Flash Floods, Conflict, PPR/FMD)│
└───────────────────────────┬────────────────────────────┘
                            │
                            ▼
┌────────────────────────────────────────────────────────┐
│   LIVESTOCK PRODUCTION SYSTEMS CAPITAL                 │
│   (Herd Sizes in TLU, Grazing Rights, Customary Rules) │
└───────────────────────────┬────────────────────────────┘
                            │
                            ▼
┌────────────────────────────────────────────────────────┐
│   MARKET INTEGRATION & VALUE CHAIN PATHWAYS             │
│   (Domestic Urban Markets vs. Informal Cross-Border)    │
└───────────────────────────┬────────────────────────────┘
                            │
                            ▼
┌────────────────────────────────────────────────────────┐
│   SOCIO-ECONOMIC OUTCOMES                              │
│   (Income Inflows, Enhanced Resilience, Food Security) │
└────────────────────────────────────────────────────────┘
Study Design
This study utilizes a mixed-methods descriptive and analytical study design. It combines quantitative econometric modeling of secondary household survey datasets and customs trade balances with qualitative value-chain analysis drawn from pastoral development studies and policy reviews.
Data Sources
Data inputs were compiled from the Central Statistical Agency (CSA) livestock reports, the Ministry of Agriculture (MoA) strategic briefings, World Bank open economic databases, UN COMTRADE statistics, and multi-year custom tracking sheets provided by the Ethiopian Customs Commission.
Data Analysis Techniques
Quantitative calculations were executed to standardize diverse livestock metrics, model temporal export performance trends, and evaluate trade gaps between formal custom registries and informal baseline estimations. Qualitative analysis focused on assessing value-chain bottlenecks and institutional frameworks across pastoral areas.
Econometric Model
To evaluate the specific determinants of household income and asset security within pastoral and agro-pastoral communities, a classical Ordinary Least Squares (OLS) multi-variable linear regression model is constructed:
Yi = β0 + β1(TLUi) + β2(DistMi) + β3(VetAcci) + β4(HHSizei) + εi
| Variable Symbol | Variable Definition & Measurement Base | Expected Sign | Theoretical Justification |
|---|---|---|---|
| Yi | Total Household Annual Income (Monetary + Consumption Value) | Dependent | Primary welfare and livelihood measurement metric. |
| TLUi | Total Livestock Wealth owned measured in Tropical Livestock Units | (+) | Higher livestock wealth directly expands production and sales. |
| DistMi | Physical distance to the nearest livestock market hub (Kilometers) | (-) | Longer distances increase transport costs and weight loss. |
| VetAcci | Frequency of access to professional veterinary support (Scale 0-1) | (+) | Improved animal health reduces mortality and raises quality. |
| HHSizei | Size of the household unit (Total number of family members) | (+/-) | Increases available labor but raises consumption needs. |
| Source: canonical Table 3 — Econometric Variables and Expected Relationships. | |||
This study provides a multi-dimensional analysis connecting macro-level trade dynamics with micro-level household survey realities. By doing so, it provides actionable evidence for AU-IBAR and regional development actors to support targeted policy designs and infrastructure investments.
I hereby declare that this report entitled "Socio-Economic Contribution of Livestock to the Ethiopian Economy: A Focus on Pastoral and Agro-Pastoral Systems" is an original work prepared for academic and policy analysis purposes. The information presented in this report has been obtained from reliable secondary sources, policy documents, study publications, and development reports. All sources used in the preparation of this report have been duly acknowledged and referenced.
Jemal Aliye Gendo Date: May 10, 2026
The successful completion of this report would not have been possible without the support of various institutions, experts, and development partners working in the livestock sector in Ethiopia. Special appreciation is extended to the African Union – InterAfrican Bureau for Animal Resources (AU-IBAR) for the opportunity and institutional support provided during the preparation of this study.
Gratitude is also extended to the Ministry of Agriculture, development organizations, study institutions, and statistical agencies whose reports and publications served as valuable sources of information for this assessment. Appreciation is further expressed to pastoral and agro-pastoral development practitioners whose experiences and insights contributed to strengthening the analytical perspectives of the report.
Finally, sincere appreciation is extended to all professionals and stakeholders working toward sustainable livestock sector transformation and pastoral development in Ethiopia in particular.
| Acronym | Meaning |
|---|---|
| AU-IBAR | African Union – InterAfrican Bureau for Animal Resources |
| APMD | African Pastoral Markets Development Platform |
| CSA | Central Statistical Agency |
| DRSLP | Drought Resilience and Sustainable Livelihoods Program |
| FAO | Food and Agriculture Organization |
| FMD | Foot and Mouth Disease |
| GDP | Gross Domestic Product |
| GDPA | Gross Domestic Product from Agriculture |
| GoE | Government of Ethiopia |
| IGAD | Intergovernmental Authority on Development |
| ILRI | International Livestock Research Institute |
| ILO | International Labour Organization |
| LMP | Livestock Master Plan |
| MoA | Ministry of Agriculture |
| NGO | Non-Governmental Organization |
| OLS | Ordinary Least Squares |
| PPR | Peste des Petits Ruminants |
| PPP | Public-Private Partnership |
| SPS | Sanitary and Phytosanitary Standards |
| TVET | Technical and Vocational Education and Training |
| UNDP | United Nations Development Programme |
| USAID | United States Agency for International Development |
| WTO | World Trade Organization |
| Source: canonical List of Acronyms. | |