


In Chad, livestock is often described as the “second udder” of the economy after oil. Its contribution is vital for socio-economic stability, although its statistical weight varies according to source and calculation methodology.
Estimates of the share in National GDP range from 18% of GDP in direct value added, rising to ~53% across the full value chain including own-consumption (AfDB/PAPCVL). Recent INSEED reports indicate average growth of livestock and hunting activity of 5.9% over the period 2019-2022.
- Livestock dominates the rural sector and represents about 37% to 53% of agricultural GDP.
- The sector generates about 30% of the country’s total exports and more than 50% of non-oil exports.
- It supports about 40% of the total population and more than 70% of the rural population.
Chad’s national accounts, although they migrated to the SNA in 2008, face major methodological challenges.
Chad exports live animals almost exclusively: meat exports (US$131k) are ~1/740th of live-animal exports (US$97m), indicating virtually no domestic processing value addition. Chad’s livestock exports crossed a historic threshold to reach 220 billion FCFA (about 360 million US dollars) according to consolidated official data from the Bank of Central African States (BEAC). Customs records 56bn FCFA in formal live-animal exports (Table 8), of which 35.7bn (64%) went to Cameroon; BEAC’s 220bn FCFA is a consolidated estimate including informal trade — the two figures are not directly comparable.
The national and institutional data gaps cited above limit the formal recognition of pastoral contributions, thereby hampering the design of appropriate public policies and investments.
The true economic value of pastoralism remains underestimated, which obscures its crucial role in food security and regional value chains.
Closing these data gaps or shortfalls is a strategic priority in order to quantify the real contribution of pastoralists and to fully integrate the sector into national development strategies.
| Indicator | Value | Year | Official source |
|---|---|---|---|
| National GDP (current USD) | $20.63 billion | 2024 | World Bank |
| Agriculture % of GDP | 32.15% | 2024 | World Bank |
| Livestock % of GDP | ~18% | 2024 | AfDB, PAPCVL |
| Livestock % of agricultural GDP | ~56% | 2024 | World Bank |
| Livestock GDP (current USD) | ~$3.71 billion | 2024 | World Bank |
| Total cattle population | ~41,749,703 | 2025 | RGE, DRSE |
| Total sheep population | ~56,668,519 | 2025 | RGE, DRSE |
| Total goat population | ~55,591,608 | 2025 | RGE, DRSE |
| Total camelid population | ~12,132,800 | 2025 | RGE, DRSE |
| Rural/agricultural population | ~14.8 million | 2024 | 75-80% of total, IFAD/AfDB estimate |
| % of rural/agricultural population | ~75-80% | 2024 | IFAD / AfDB |
In Chad, there is a diversity of domestic-ruminant livestock systems. A classification based on the degree of mobility of herders and their livestock, the level of integration of crops with livestock, and the mode of management and use of space allows two main ones to be distinguished: the pastoral system and the agropastoral system. To these two extensive systems (of varying degrees) are added the agro-herders (farmers owning a few animals) and the peri-urban systems oriented toward intensification (farms), which are very much in the minority. Studies characterizing livestock systems, and above all estimating their importance and performance, are sorely lacking (Hiernaux et al., 2021).
Livestock in Chad represents a major economic pillar that contributes more than 50% of the rural sector’s GDP. The management of the national herd (estimated at more than 100 million head of livestock) rests on a great diversity of production systems dictated by the country’s agroecological zones.
2.2.1 Pastoral system (extensive and mobile)
This system rests entirely on the mobility of herds (transhumance and nomadism) to exploit natural water and pasture resources. Agriculture is almost non-existent or secondary. The species concerned by this system are cattle in the centre-south, camels in the north, and sheep and goats across the whole territory. It concentrates about 80% of the national herd.[1] It is subdivided into long-range nomadism (north-Saharan, ≈11%) and seasonal transhumance (Sahelo-Sudanian, ≈21%).
2.2.2 Agropastoral system
This system combines mobile livestock keeping with rain-fed subsistence agriculture. Herders practise short transhumance and grow cereals (millet, sorghum) around their home areas (terroirs). This system manages a significant share of the sedentary/low-amplitude category, estimated overall at between 10 and 15% of the national herd.
2.2.3 Mixed crop-livestock system (sedentary)
Practised mainly in the Sudanian zone (in the South), where agriculture is the main activity. Farmers own small sedentary herds used for animal traction, manure production and savings. This system represents about 5 to 8% of the overall herd but holds a significant proportion of draught animals.
2.2.4 Intensive and peri-urban system
Located around the large urban agglomerations (such as N’Djaména), this system is oriented toward rapid commercialization. It includes intensive cattle/sheep fattening and modern dairy farms. Very much a minority, this model represents less than 1 to 2% of the national herd but is progressing rapidly owing to urban demand.
2.2.5 Main pastoral groups and geographic distribution
The dynamics of Chadian livestock keeping are deeply linked to specialized ethnic and cultural groups, distributed from the north to the south of the territory along the isohyets:
| Agroecological zones | Main ethnic groups |
|---|---|
| Saharan zone (North) | Goranes (Toubou, Daza) & Berbers, Zaghawa |
| Sahelian zone (Centre) | Arabs, Kanembou & Boudouma |
| Sudanian zone (South) | Seasonal mobility of the Fulani (Mbororo) |
- The Goranes (Toubou, Anakaza, Daza): Present in the Saharan and northern zone (Borkou, Ennedi, Tibesti, Kanem, Barh El Gazel). They are predominantly keepers of dromedaries and small ruminants, adapted to hyper-arid environments.
- The pastoral Arabs (cattle keepers or “Baggara”, camel keepers or “Abbala”): They occupy an immense band in the centre of the country (Ouaddaï, Batha, Chari-Baguirmi, Hadjer-Lamis, Salamat). They manage the major part of the cattle herd and practise long-distance transhumance toward the south during the dry season.
- The Fulani (Mbororo, Foulbé): Traditionally mobile, they move mainly in the southern Sahelian zone and the Sudanian zone (Mayo-Kebbi, Logone, Moyen-Chari). Their movements extend increasingly toward the far south owing to climate change.
- The Zaghawa and Bideyat: Located in the East and North-East of the country (Ennedi and Wadi Fira regions). They are pastoralists specialized in keeping small ruminants and dromedaries.
- The Kanembou and Boudouma: Established mainly in the Lake Chad region, they exploit the island pastures and notably manage the local Kouri cattle breed (characterized by its enlarged floating horns).
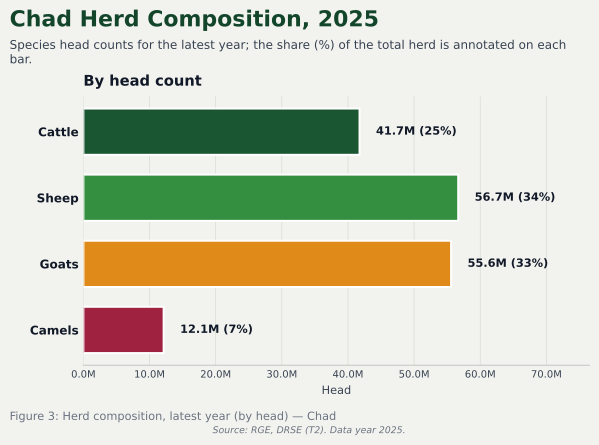
Chad is a major livestock country, with one of the largest national herds in its region, estimated in 2021 at 134,351,938 head of livestock according to data updated by the General Livestock Census Bureau (now DRSE). This herd is distributed by species in the table below:
| Species | Sedentary | Transhumant | Nomadic | Farm | Total | |
|---|---|---|---|---|---|---|
| Number | % | |||||
| Cattle | 16,900,896 | 5,227,760 | 2,760,013 | 3,429 | 24,892,098 | 27.0 |
| Sheep | 18,700,944 | 3,211,190 | 4,522,387 | 1,649 | 26,436,170 | 28.7 |
| Goats | 25,798,311 | 2,071,239 | 2,649,389 | 410 | 30,519,349 | 33.1 |
| Camels | 2,797,027 | 1,176,591 | 2,439,703 | 200 | 6,413,521 | 7.0 |
| Equines | 902,795 | 86,296 | 84,319 | 88 | 1,073,498 | 1.2 |
| Asses | 2,348,092 | 212,022 | 244,084 | 12 | 2,804,210 | 3.0 |
| TOTAL Livestock | 67,448,065 | 11,985,098 | 12,699,895 | 5,788 | 92,138,846 | 100.0 |
| % livestock | 73.2 | 13.0 | 13.8 | 0.0 | 100.0 | |
| Source: Chad, General Livestock Census – RGE, 2018 | ||||||
The last exhaustive official inventory at the national scale is the General Livestock Census (RGE), whose field-collection phase took place in 2015, with official publication of the final results by the Ministry of Livestock and the FAO in Chad in 2018.
In order to keep the statistics up to date, the General Livestock Census Bureau carries out regular projections and updates. The most recent consolidated official data date from 2021. Ruminants (goats, sheep, cattle) form the core of the sector and represent more than 85% of total mammal numbers.
The evolution of the Chadian herd over the last 20 years shows a spectacular overall increase, characterized by a near-doubling of total numbers.
- Exponential growth: In 2007, estimates from the Directorate of Pastoral Studies and Statistics (DESP) reported only 6.9 million sheep, 6.1 million goats and 2.8 million cattle. The shift to more than 33 million cattle and 40 million small ruminants shows strong alignment with the overall demographic growth rate of the region.
- Change in structure: Small ruminants (sheep and goats) increased more rapidly than cattle, because they adapt better to the recurrent drought cycles of the Sahelian zone.
- Capitalization: This dynamism confirms that the pastoral sector serves as a bank on the hoof for rural households, representing essential financial capital for about 40% of the rural population.
The precise calculation of the animal population in Chad runs into major structural constraints that affect the regularity and absolute reliability of the databases:
- The high mobility of herds: The Chadian livestock system is predominantly characterized by nomadic pastoralism and long-distance transhumance (national and cross-border). Counting animals in constant movement creates significant risks of double-counting or omissions.
- The vastness and landlockedness of the territory: Covering the Sahelian and Saharan zones (North and Centre) represents a colossal logistical and financial challenge, limiting the frequency of exhaustive censuses (several decades have elapsed between the major inventory operations).
- The reluctance of herders: Livestock owners often equate the counting of animals with future fiscal pressure (pastoral levies or taxes), which leads to sometimes underestimated declarations.
- The lack of permanent statistical infrastructure: Although FAO supports the establishment of a Permanent Livestock Statistics System (SPSE), the inter-census data often rest on theoretical projection models based on calving and mortality rates, rather than on regular physical counts.
Livestock is the major economic pillar of rural and pastoral households in Chad. It constitutes a vital source of income, a food and financial safety net, and a driver of empowerment for local populations. It employs about 80% of the active population (rural and pastoral sectors included) and generates direct or indirect income for about 40% of the country’s total population.
Data on the income generation of pastoral households remain non-exhaustive. However, a few studies provide useful information:
PRAPS TD baseline survey
Within the framework of the implementation of PRAPS 1 in Chad, the first baseline survey was carried out between 2017-2018 (final report submitted in December 2018) in the PRAPS-Chad intervention area covering 12 regions, which are: Hadjer Lamis, Kanem, Barh Al Ghazal, Batha, Guéra, Borkou, Ennedi East and Ennedi West, Wadi Fira, Ouaddaï, Sila and the Lac region.
The survey covered a sample of 459 pastoral and agropastoral households and showed that almost all of these households are headed by men, at 98%. Pastoral and agropastoral households generate average overall incomes of 2,235,171 FCFA/year. Half of the surveyed households have average incomes exceeding 994,600 FCFA, while the other half generate average incomes below this amount.
Households derive their income mainly from sales of live animals, which represent a proportion of 41.8% of the income generated. The marketing of agricultural products constitutes the second-largest source of income with a share of 24.7% of overall income. Sales of agricultural products are particularly important in the regions of Batha, Hadjer-Lamis and Guera, which represent respectively 30, 22 and 16% of the agricultural income generated. These regions benefit from climatic conditions favourable to the practice of these activities, or to recession (décrue) crops as in the Batha region. Own-consumption is assessed at 21.3% of overall income, while sales of dairy products contribute only 2.6%. This reflects in particular the importance of own-consumption of dairy and agricultural products in terms of their contribution to food security, as well as households’ trade-off between the consumed and marketed shares. This income from own-consumption was valued at market price and counted as “non-monetary” income. As for the other sources of income, their share is assessed at 9.6%. These included wages, income from other activities such as trade, transfers and subsidies. (Wane et al., 2017)
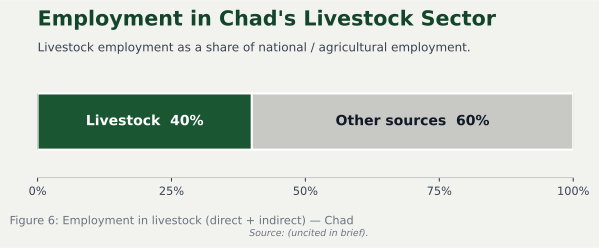
The livestock sector in Chad is a major socio-economic pillar that supports about 40% of the national population and contributes 53% of the rural sector’s GDP.
- 80% of the national active population works in the rural development sector, including agriculture and livestock combined.
- 40% of the total population (mainly rural) derives its direct or indirect income from livestock activity.
- More than 50% of the labour force of this rural and pastoral world is composed of women, who play a central role in herd management and the sale of derived products.
- 80% of the herd is managed through a mobile pastoral livestock system (transhumance), which generates community-based and seasonal employment.
According to RGE 2018, 827,167 households are headed by livestock keepers — 451,724 (54.6%) male and 375,443 (45.4%) female.
The analysis of the employment structure highlights a clear distinction between direct employment, strongly linked to traditional pastoralism, and indirect employment in the process of being structured.
| Value-chain segment | Type of employment | Nature of the main activity | Degree of formalization |
|---|---|---|---|
| Livestock & Production | Direct | Herding, guarding, milking | Very informal (family/community) |
| Livestock Trade | Direct | Collection, brokering, droving on the hoof | Informal but highly organized |
| Processing | Direct | Slaughtering, butchery, tannery, dairy | Mixed (craft to industrial zones) |
| Input Supply | Indirect | Sale of animal feed, mineral supplements | Growing rapidly in urban centres |
| Transport & Logistics | Indirect | Truck transport, cross-border logistics | Undergoing modernization |
| Veterinary Services | Indirect | Care, sale of medicines, vaccination | Professional (public and private sectors) |
3.2.1. Analysis of direct employment
Direct employment encompasses the activities in immediate contact with the animal and its derived products. [8]
- Livestock and Production: This segment employs the majority of the rural labour force. About 80% of the Chadian herd depends on the mobile pastoral system (transhumance and nomadism). The jobs there are essentially family-based, non-salaried, and based on the daily management of herds, guarding and milking.
- Livestock Trade: Chad is a leading livestock exporter in its sub-region. The commercial network mobilizes thousands of people: herder-sellers, local intermediaries (Dallali), cross-border buyers and the drovers who move livestock on foot or by truck to Nigeria, Cameroon or the Republic of the Congo.
- Product Processing: This sector is gradually professionalizing. It includes dairy-farm operators, butchers and leather craftsmen (hides and skins). The industrialization projects (such as the construction of modern abattoirs and special processing zones) aim to create more formal jobs for young people.
3.2.2. Analysis of indirect employment
Indirect employment encompasses the services and supply chains indispensable to maintaining the value chain.
- Input Supply: The shrinking of pastoral spaces is pushing toward sedentarization. This stimulates employment in the manufacture and sale of concentrated feed (cottonseed cake), mineral supplements and equipment for peri-urban livestock keeping.
- Transport and Logistics: Faced with the difficulties of transhumance on foot (agropastoral conflicts, insecurity), the transport of livestock by truck is gaining ground. This shift generates jobs for long-haul drivers, mechanics, loaders and logistics-yard managers.
- Veterinary and Sanitary Services: This component employs qualified professionals: veterinary doctors, livestock technicians and animal-health agents. They work within the public services of the Ministry of Livestock, in private practices, or in international organizations such as VSF, ICRC, etc. They ensure vaccination, the treatment of pathologies and sanitary control in markets.
The main activities carried out by the population of pastoral households are essentially agriculture and livestock keeping. Among males, agriculture (excluding market gardening) represents 70.8% of the activities carried out, against 11.3% for livestock. Likewise, among women, agriculture represents 71.8% and livestock 10.4%. (RGE, 2018)
| Main activity of the household head | Urban | Rural | Total | |||||||||
|---|---|---|---|---|---|---|---|---|---|---|---|---|
| Male | Female | Male | Female | Male | Female | |||||||
| Number | % | Number | % | Number | % | Number | % | Number | % | Number | % | |
| Agriculture | 289,455 | 45.1 | 260,342 | 45.6 | 2,530,787 | 75.7 | 2,328,903 | 76.7 | 2,820,241 | 70.8 | 2,589,246 | 71.8 |
| Market gardening | 12,148 | 1.9 | 11,962 | 2.1 | 80,578 | 2.4 | 65,464 | 2.2 | 92,726 | 2.3 | 77,425 | 2.1 |
| Livestock | 67,174 | 10.5 | 57,724 | 10.1 | 384,550 | 11.5 | 317,719 | 10.5 | 451,724 | 11.3 | 375,443 | 10.4 |
| Fishing | 5,917 | 0.9 | 6,261 | 1.1 | 20,800 | 0.6 | 18,324 | 0.6 | 26,717 | 0.7 | 24,584 | 0.7 |
| Hunting | 80 | 0.0 | 80 | 0.0 | 394 | 0.0 | 342 | 0.0 | 474 | 0.0 | 423 | 0.0 |
| Forestry | 1,518 | 0.2 | 1,538 | 0.3 | 951 | 0.0 | 1,222 | 0.0 | 2,469 | 0.1 | 2,760 | 0.1 |
| Beekeeping | 19 | 0.0 | 19 | 0.0 | 1,830 | 0.1 | 1,755 | 0.1 | 1,849 | 0.0 | 1,773 | 0.0 |
| Floriculture | 1,819 | 0.3 | 713 | 0.1 | 2,020 | 0.1 | 984 | 0.0 | 3,839 | 0.1 | 1,697 | 0.0 |
| Trade | 107,367 | 16.7 | 98,433 | 17.3 | 121,684 | 3.6 | 112,091 | 3.7 | 229,051 | 5.7 | 210,524 | 5.8 |
| Crafts | 10,734 | 1.7 | 9,324 | 1.6 | 25,782 | 0.8 | 22,607 | 0.7 | 36,516 | 0.9 | 31,931 | 0.9 |
| Civil servant | 70,400 | 11.0 | 57,058 | 10.0 | 32,659 | 1.0 | 29,903 | 1.0 | 103,059 | 2.6 | 86,962 | 2.4 |
| Pupil / Student | 10,773 | 1.7 | 8,367 | 1.5 | 21,828 | 0.7 | 19,829 | 0.7 | 32,601 | 0.8 | 28,197 | 0.8 |
| No activity | 27,623 | 4.3 | 26,186 | 4.6 | 73,072 | 2.2 | 70,581 | 2.3 | 100,695 | 2.5 | 96,767 | 2.7 |
| Other activity | 37,351 | 5.8 | 32,403 | 5.7 | 44,473 | 1.3 | 44,869 | 1.5 | 81,824 | 2.1 | 77,272 | 2.1 |
| Chad total | 642,376 | 100.0 | 570,410 | 100.0 | 3,341,409 | 100.0 | 3,034,594 | 100.0 | 3,983,784 | 100.0 | 3,605,005 | 100.0 |
| Source: Chad, General Livestock Census - RGE 2012/2015 | ||||||||||||
NB: This trend is more pronounced in rural areas, where the proportion of men with agriculture as their main activity is 75.7%, against 76.7% for women. In urban areas, by contrast, the proportion of people practising agriculture is 45.1% for men and 45.6% for women.
However, agriculture remains the main activity most practised by the pastoral population, followed by livestock (11.3% of men and 10.4% of women) and trade (5.7% of men and 5.8% of women). It is also noted that, in urban areas, there are as many civil-servant household members practising livestock keeping as household members carrying out livestock keeping as their main activity (respectively 11% and 10.5% among men, against 10% and 10.1% among women).
In the pastoral and arid zones of the country, livestock is not only a production activity but the central mechanism of adaptation and the main financial safety net of households in the face of a hostile environment.
In the arid and Sahelian ecosystems, the herd fulfils three interdependent resilience functions:
-
1.1. Maximizing transhumant mobility
- Transhumance makes it possible to exploit the spatio-temporal variability of pastures and water points.
- By moving herds from the arid north to the Sudanian south in the dry season, herders transform marginal and non-cultivable lands into high-value-added protein (milk, meat).
-
1.2. Livestock constitutes a bank on the hoof
- Livestock acts as a liquid savings account and a reserve asset.
- In the absence of access to formal rural financial services, the sale of small ruminants (sheep, goats) makes it possible to finance the immediate purchase of cereals during the lean season or to cover urgent expenses (health, education).
-
1.3. Diversification of food and income contributions
- Milk and its derivatives (butter, cheese) stabilize the family diet.
- The sale of dairy products provides pastoral women with regular autonomous income, thereby creating a direct barrier against acute food insecurity.
Despite its intrinsic flexibility, the Chadian pastoral system undergoes violent cumulative shocks (climatic, sanitary and security-related) that cause a relatively accelerated decapitalization of households.
3.3.1 Climate shocks and biomass degradation
The poor distribution of rainfall in time and space regularly generates massive biomass deficits. Prolonged droughts cause early exhaustion of pastures and immediate mortality of animals by starvation.
Moreover, Chad also faces record floods that break the transhumance routes, drown livestock and destroy pastoral infrastructure.
3.3.2 Epizootics and sanitary barriers
According to IOM survey data among transhumant herders (notably in the Lac province), 68% of pastoral households report massive livestock losses, the great majority (93%) being attributed to seasonal animal diseases for lack of adequate and accessible vaccination coverage.
3.3.3 Insecurity and deadly conflicts
The shrinking of transhumance corridors caused by the advance of the agricultural front and the expansion of villages blocks the historic livestock passage routes. Tensions linked to shared access to natural resources generate extremely violent agropastoral conflicts. By way of example, the recurrent inter-community clashes (such as those of Mandakao in 2024) result in dozens of human losses and massive thefts of entire herds.
Moreover, in the Lake Chad zone, herders are doubly penalized by the recurrent livestock theft perpetrated by extremist armed groups and by financial scams.
3.3.4 Consequences/impact on the well-being of pastoral households
The collapse of livestock capital structurally destroys the living conditions of pastoral communities:
- Distress sales and decapitalization: Faced with the lack of fodder, herders sell off their animals at derisory prices to buy food. This “decapitalization” reduces their livelihoods to nothing in the long term.
- Deterioration of food consumption: The loss of animals stops milk production. Combined with the surge in cereal prices on disconnected markets, it tips many provinces into acute food crisis (IPC Phase 3).
- Impoverishment and forced sedentarization: Deprived of herds, herders undergo extreme impoverishment, forcing them to abandon mobility to convert to rural exodus or precarious day labour.
NB: The table in the annex of the document shows a chronological evolution of the various shocks.
Livestock plays an important role in the economy of many countries, particularly in Chad, where it constitutes a fundamental pillar of rural activities. Beyond its income contribution, this sector contributes significantly to food and nutrition security and to the well-being of local communities. Livestock plays a decisive but contrasting role in the country’s food and nutrition security.
However, its immense potential does not prevent the country from facing chronic nutritional vulnerability.
3.4.1 Per-capita consumption of animal-source foods
The consumption of animal-source products in Chad is strongly marked by significant geographic and economic disparities:
- Meat: The national average consumption stands at about 13.4 kg per capita per year (i.e. nearly 36 g per day). It is twice as high in urban areas as in rural areas, owing to the lower purchasing power of rural households, who allocate their herd to sale.[2]
- Milk: Access to milk depends strongly on lifestyle. Herders and their families consume about 100 litres of milk per year, while city-dwellers and farmers stop at an average of only 9 litres per year.[3]
3.4.2 Share of animal-source protein (ASP)
Animal-source foods (meat, offal, milk, fish) overall provide only 7% of the total dietary energy supply (DES). The Chadian diet remains little varied and predominantly based on cereals. This low proportion limits the bioavailability of essential micronutrients such as iron, zinc or vitamin A.
3.4.3 Livestock ownership and nutritional outcomes in pastoral areas
Direct access to the herd has a measurable but complex buffering effect on nutritional status:
- Impact on acute malnutrition (wasting): Humanitarian projects, such as those of FAO conducted in Kanem and Barh-El-Gazel, demonstrate that integrated livestock management focused on milk production and consumption significantly reduces acute malnutrition among children under 5 and breastfeeding women during the lean season.
- Impact on chronic malnutrition (stunting): The correlation between livestock ownership and reduction of stunting remains mainly documented by cross-sectional observational studies. The benefits are intimately linked to the direct consumption of fresh milk within the pastoral household. However, in the event of a major climatic or economic crisis, herders sell their livestock to buy cereals, which can paradoxically deteriorate dietary diversity in the long term.
The overall nutritional situation remains classified as worrying to critical:
Regarding global acute malnutrition (GAM), it exceeds the WHO alert threshold of 10% at the national level. The epidemiological analyses (2025 SMART surveys) indicate that 15 of the 23 provinces are critically affected. About 2 million children aged 6 to 59 months suffer from acute malnutrition over the annual cycle.
As for stunting, it affects +31.9% of children under five at the national level, reaching alarming peaks of nearly 48.2% in the Lake zone.
Finally, acute food insecurity: Exacerbated by regional conflicts (influx of Sudanese refugees in the East), inflation and climate shocks (floods), the population in need of food assistance regularly oscillates between 2.5 and 3.8 million people, particularly during the lean season from June to September.
The marketing of livestock rests on a network of interconnected markets and long cross-border circuits, while the value chain undergoes a strategic transition from a traditional on-the-hoof model toward an industrialization of meat. The country has more than 135 livestock markets, of which 71 are considered major by the authorities. There are several types of livestock market:
- Collection or bush markets (primary): Located in rural production areas, supplied directly by the surrounding pastoralists and agropastoralists. They allow herders to sell their first animals to meet immediate financial needs.
- Grouping markets (secondary): Relatively better-equipped infrastructure (such as the Karmé market) where intermediaries and large traders assemble the animals into homogeneous lots. The large intermediate towns such as Massakory, Ati, Moussoro, Abéché and Karmé, for example.
- Terminal and border markets: N’Djamena (urban consumption), Bongor or Pala (export gateways to Cameroon and Nigeria).
(Production zone / Herders)
│
▼
Collection markets (Rural) ──► Local consumption
│
▼
Grouping / Relay markets ──► Urban abattoirs (N’Djamena)
│
▼
Border/Terminal markets ──► Exports (Nigeria, Cameroon, CAR, Gabon)
In Chad, livestock markets constitute the heart of the pastoral value chain. Each actor plays a precise economic and social role there to ensure the supply of meat and the generation of income. The value chain rests on a network of interconnected actors, often structured by traditional, family or ethnic ties. It coexists between a historical low-value-added model and a relatively emerging industrial modernization.
[Pastoral Production] ➔ [Collection / Intermediaries] ➔ [Terminal Markets] ➔ [On-the-Hoof Export] (Traditional Chain) ➔ [Slaughter & Processing] ➔ [Meat Export] (Modern Chain)
| Actors | Main roles in the value chain |
|---|---|
| Herders / Pastoralists | • Ensure the production phase (breeders, transhumant or sedentary herders). • Manage the herds and bear the sanitary and climatic risks. • Capture about 48% of the final value of the exported livestock. |
| Intermediaries ( Dalali and Guarantors) | • The Guarantor ( Damine ) certifies ownership of the animal and secures the sale against the risk of theft. • The Dalali (broker) connects buyers and sellers and negotiates the price. |
| Traders (Collectors / Wholesalers) | • The collecting agents travel the rural markets to buy livestock at retail. • The large traders group the animals into droving herds to move them on foot toward the borders or the large centres. |
| Processors (Butchers / Industrialists) | • Traditional butchers: Ensure local slaughter and the retail sale of meat on the stalls of urban markets. • Modern units: The sector is initiating an industrial transition with infrastructure such as the Moundou abattoir (Laham Tchad) and the development of Special Economic Zones (SEZ) to process and export refrigerated/frozen meat. |
| Consumers | • National: Buy meat mainly on traditional local markets, with a strong requirement for immediate freshness. • Regional (Export): Final consumers in Nigeria, Cameroon or Gabon who absorb the live livestock or the processed meat imported from Chad. |
Historically, the country’s infrastructure suffers from a lack of facilities; the markets are placed on simple open, unfenced spaces, without water points or shade.
However, programmes such as PRAPS 2 are modernizing the network:
- Construction of modern fenced markets with holding pens (zeriba).
- Installation of vaccination corridors, water-supply systems (pastoral boreholes) and drinking troughs.
- Establishment of community management committees to ensure maintenance.
Furthermore, the offtake rate and the price dynamics of livestock are explained as follows:
- Offtake rate: Livestock markets open on a weekly basis; the main markets display strong vitality. For example, on a dynamic market, a herder can sell off nearly half of his animals in a single day.
- Price variability: The price of an adult bovine varies strongly according to its conformation, the season and the destination. A large bovine can reach 700,000 FCFA on a grouping market, while small ruminants fluctuate around 75,000 FCFA.
- Seasonality: Prices fall at the end of the dry season (lack of pastures, weakened animals) and rise sharply during the rainy season (natural fattening) and during religious festivals (Tabaski, Christmas).
- Price paradox: High-value large livestock is almost exclusively exported on the hoof to Nigeria because local butchers cannot make the purchase profitable against national purchasing power. Chadian domestic consumption is therefore oriented toward lower-value animals.
As for meat processing, Chad has 2 large functional modern industrial abattoirs (the AFF in N’Djamena and the CIAL in Moundou) and 48 developed slaughter areas.
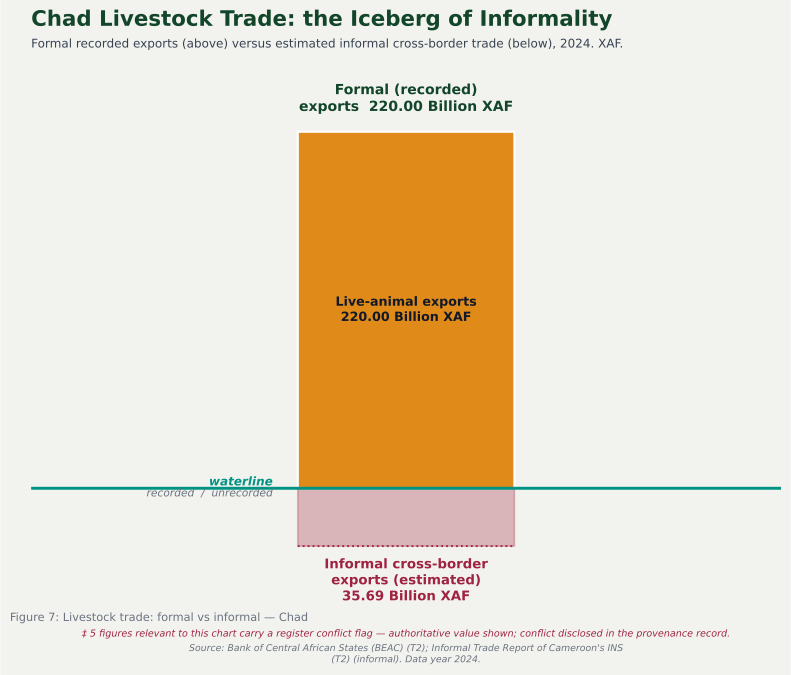
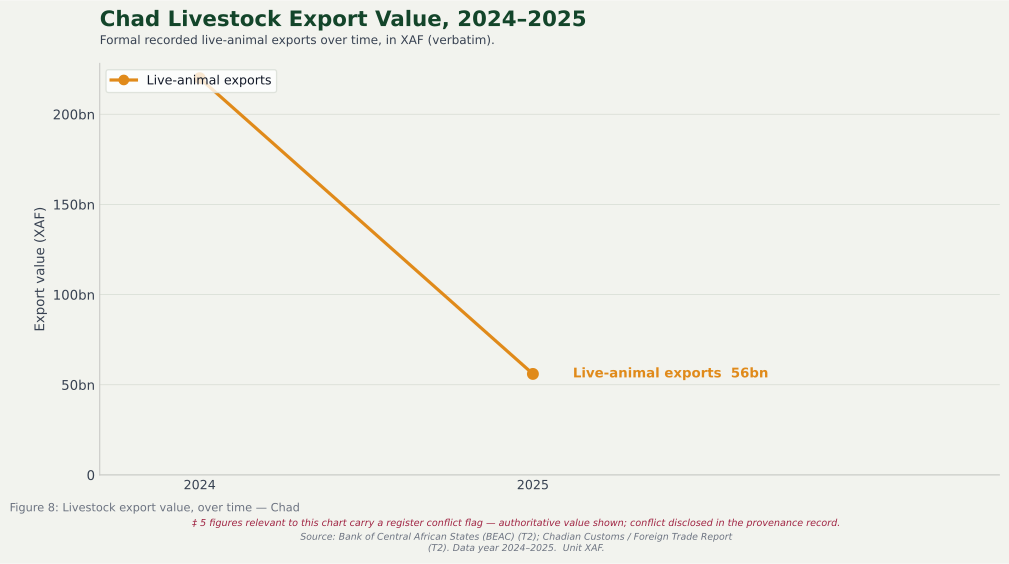
The marketing of livestock rests on a network of interconnected markets and long cross-border circuits, while the value chain undergoes a strategic transition from a traditional on-the-hoof model toward an industrialization of meat.
Four axes structure the marketing flows of Chadian livestock on the hoof, which are:
- The West corridor (Nigeria axis via Cameroon): This is the most dynamic and most important corridor. Animals coming from the Sahelian zones (Kanem, Bahr el Ghazal, Hadjer-Lamis) transit through interconnection markets such as Massakory, Massaguet or Dourbali, then cross the border via N’Djaména, Bongor, Pala or Fianga toward North Cameroon to supply the large urban centres of Nigeria (Lagos, Kano, Maiduguri).
- The North corridor (Libya axis): This network is mainly specialized in the conveyance of dromedaries and small ruminants from the northern regions (Borkou, Ennedi, Tibesti and Wadi Fira).
- The East circuit (Sudan axis): Less formal, this circuit drains cattle and small ruminants from the eastern provinces such as Ouaddaï, Sila and Wadi Fira toward the Sudanese markets.
- The South circuit (CAR and Republic of the Congo axis): Traditionally oriented toward the Central African Republic and the ECCAS countries, this circuit undergoes intermittent slowdowns owing to the security instability at the southern borders since 2013.
The gap between formal and informal trade (not recorded by customs) largely dominates the Chadian pastoral economy owing to porous borders and dissuasive internal taxes.
| Indicator | Formal exchanges | Informal exchanges |
|---|---|---|
| Customs registration | Strictly controlled (CEMAC livestock passport) | Totally invisible at border posts |
| Flow to Cameroon* | Marginal official share | 35.69 billion FCFA (~$63M) |
| Trend of informal flow | Stagnant | Continuous rise of +20.3% per year |
| Estimated loss for the State | – | 170 billion FCFA per year in evaded taxes |
- By way of example
The explanatory factors for the gap are:
- Artisanal and informal markets: Lack of weighing and traceability infrastructure.
- Tracing the transhumance routes: Herders favour the traditional bush tracks to avoid extortion and illicit taxes.
- Fluid capital: Dominant use of cash and community trust networks without banking inclusion.
The highlights and dynamics of the value chain in 2025 include, among others:
- Dominance of animals on the hoof: Formal trade remains dominated by live animals (56 billion FCFA of direct flows identified in 2025). If one includes all the customs circuits and the BEAC’s overall estimates, the overall livestock value chain generates more than 220 billion FCFA per year, which makes it the country’s second source of foreign exchange after oil.
- The challenge of local processing: Exports of processed meat remain nascent but are being structured thanks to the Laham Tchad public-private partnership. The State’s stated objective is to reduce on-the-hoof export in order to capture the value-added at the level of modern abattoirs such as that of Moundou.
- Weight of the informal: The porosity of the borders with Cameroon and Nigeria means that a massive share of livestock escapes official veterinary and customs controls. Data from Cameroon’s INS confirm that Chad is its leading informal supplier of livestock.
The market integration of pastoral communities in Chad is a double-edged process. On the one hand, it validates the driving role of pastoralism in the national and regional economy by creating tangible monetary value. On the other, it weakens the foundations of pastoral mobility, which nonetheless remains the strategy best adapted to arid Sahelian environments. Without strong public policies combining land-tenure security, mobile infrastructure and adapted financing systems, the law of the market risks excluding the most vulnerable herders to the benefit of urban commercial actors.
NB: From the foregoing, the key points to retain are:
- Asymmetry of the value chain: Chad is a pastoral giant with a herd of more than 100 million head. Yet it exports almost exclusively its animals on the hoof (220 billion FCFA), letting the value-added of processing (meat, hides) escape toward the coastal countries.
- Meat balance: Although a major producer, Chad imports more processed meat ($7.39 million) than it formally exports ($131,000) for lack of industrial-scale slaughter infrastructure, despite the recent emergence of modern complexes such as that of Moundou.
| Flow & product type | Value / Estimate | Year | Nature of flow | Main partners | Official source / Reference |
|---|---|---|---|---|---|
| Live-animal exports | More than 56 billion FCFA (≈97* million USD) *of which* *40.6 bn cattle, 8.7 bn camels, 7 bn sheep)* | 2025 | Formal | Nigeria, Cameroon, CAR, Sudan, Libya | Chadian Customs / Foreign Trade Report |
| Meat exports | Marginal flows / Industrialization under way (Moundou abattoir: 200 cattle/day) | 2025 | Formal | Gabon, Republic of the Congo, Nigeria, Egypt | Laham Tchad / Moundou Industrial Complex |
| Meat exports | $131,000 USD | 2024 | Formal | Angola, Gabon | OEC - Meat and edible offal in Chad Trade |
| Hide exports (Hides and skins) | ~$1.08 million USD (Consolidated data) | 2024 / 2025 | Formal | France, China | OEC World - World trade database |
| Informal cross-border exports | 35.69 billion FCFA (~$63 million USD) (Rise of 20.3% year-on-year) | 2024 / 2025 | Informal (unregistered) | Cameroon (via the Far-North region) | Informal Trade Report of Cameroon’s INS |
| Live-animal imports | ~$436,000 USD (Very low flow, national herd largely in surplus) | 2024 / 2025 | Formal | Belgium, France | OEC World - International trade data |
| Meat imports | Almost nil / Negligible (Chad produces a structural meat surplus) | 2025 | Formal | Secondary international market | World Bank Sectoral Reports |
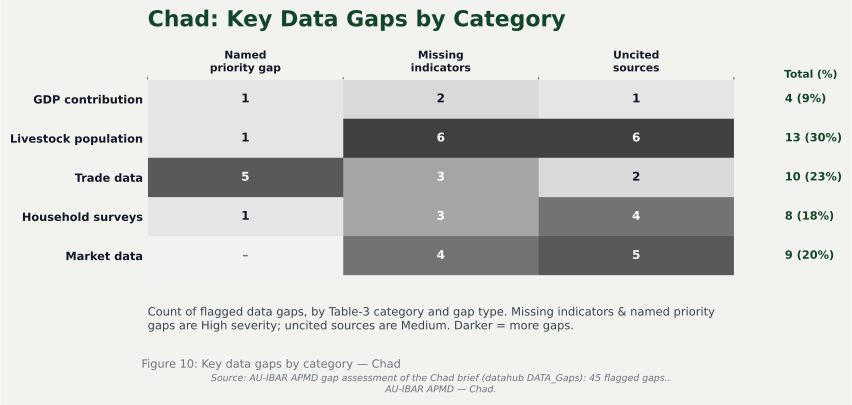
Data gaps and measurement limitations represent a major challenge for good strategic planning and better public policy. The recognition of the economic and social contribution of pastoralism in Chad runs into large gaps in data collection and major methodological limitations. Although pastoral livestock systems generate over 50% of Chad’s non-oil export earnings and of rural GDP; livestock as a whole contributes ~18% of national GDP (direct value added, AfDB/PAPCVL) and is the second source of wealth after oil, its real value remains largely underestimated in the national accounts.
5.1. The main data gaps
5.1.1. Obsolescence and irregularity of censuses
Poorly mastered herd numbers: National projections often rest on estimates extrapolated from old data. The absence of regular and precise general livestock censuses prevents the real-time monitoring of herd dynamics.
Invisibility of migratory flows: The high mobility of transhumant pastoralists complicates their integration into classic demographic surveys and routine population censuses.
5.1.2. Absence of data on informal cross-border flows
Underestimation of exports: An immense share of the on-the-hoof livestock trade toward Nigeria, Cameroon or CAR takes informal circuits to avoid taxes and administrative hassles. These massive flows escape official customs statistics.
Traceability deficit: The insufficiency of veterinary control posts and border monitoring does not allow the real volume of live-animal export transactions to be quantified.
5.1.3. Invisibility of subsistence production and the household economy
Dairy own-consumption: The milk produced in the bush by pastoral households is mainly self-consumed or bartered locally. This volume of nutritional wealth does not enter the formal commercial circuits and remains invisible to economic planners.
Invisible work of women and young people: The pivotal roles in the management of dairy processing, pastoral crafts and small ruminants are poorly documented, masking the direct social impact on communities.
5.2. Measurement limitations and methodological constraints
5.2.1. Mismatch of national statistical tools with mobility
Static methods vs. mobile reality: The collection tools (such as household surveys) are designed for sedentary populations. They fail to capture family units in constant movement over long distances across the Sahelian and Sudanian zones.
Seasonal biases: A survey carried out in the dry season in the south will not reflect the same socio-economic reality as in the rainy season when the herds move back up toward the north, which distorts the annual averages.
5.2.2. Conceptual failure in GDP calculation (National Accounts)
Restrictive macroeconomic indicators: The calculation of agricultural GDP generally only integrates the gross marketed products (direct sale of animals, abattoir meat, etc.).
Non-monetization of ecosystem services: National accounting totally ignores the value of the indirect and ecological functions of pastoralism, notably:
- The animal manure (provision of dung) transferred free of charge to agricultural soils.
- The valorization of marginal and arid rangelands unfit for agriculture.
- The animal traction power provided for crops.
5.2.3. Weak institutional and logistical capacity
There is a sore lack of human resources, means of transport, digital tools and substantial operating budgets for the Ministry of Livestock to better cover the landlocked pastoral zones.
| Data category | Description of the gap | Impact on recognition | Suggested actions |
|---|---|---|---|
| Contribution to GDP | The predominance of on-the-hoof livestock marketing. Lack of local processing infrastructure (modern abattoirs, dairy plants). | The absence of value-added conceals the real weight of the sector in official statistics and deprives the State of significant tax revenue | Accelerate the transition toward an industrialization of the value chain through PPPs, notably by making concrete processing industrial zones to valorize meat, hides and dairy products on site |
| Herd numbers | The fragility and lack of regular updating of statistical monitoring systems, combined with the absence of a digital identification and individual-traceability device for animals in movement | Imprecision of the numerical data and the informal nature of cross-border transhumance flows minimize the strategic importance of the sector to donors and mask its real contribution to regional trade | Generalize the campaigns of subcutaneous microchips or connected ear tags for livestock, while strengthening the capacities of the RGE Bureau in order to digitize the real-time mapping of numbers |
| Livestock trade | Predominance of informal circuits and exclusive export of on-the-hoof livestock along poorly secured cross-border corridors | The absence of traceability and the non-declaration of these trade flows render invisible the true financial contribution of the sector, thereby depriving the country of official foreign exchange and keeping herders in precariousness vis-à-vis intermediaries. | Formalize and modernize this trade by creating regulated cross-border trading posts, while substituting the export of on-the-hoof livestock with that of refrigerated, ready-to-consume meat thanks to the development of integrated cold chains. |
| Household surveys | The intermittent nature, their geographic coverage often restricted by insecurity, and the systematic underestimation of own-consumption (notably milk consumed within the home). | Invisibility of the real contribution of the pastoral household economy to national food security, thereby leading public policies to marginalize the budgetary investments allocated to mobility and nomadic infrastructure. | Institutionalize a permanent system of harmonized data collection at the national scale through a digitized pastoralism observatory, integrating rapid-assessment methodologies that faithfully count the invisible flows of dairy production and own-consumption. |
| Market data | The lack of computerized systems to collect and disseminate prices in real time | The absence of reliable price bulletins and transparent data keeps these markets in the informal sector, which prevents the precise measurement of the financial value of transactions and weakens the bargaining power of herders vis-à-vis the networks of speculators. | Modernize and legally register these markets by equipping them with connected weighing scales and a national mobile price-monitoring application, jointly managed by herder associations and the communes to secure the revenue. |
6.1 Main conclusion
Pastoralism in Chad contributes significantly to the economy, both at the household level and at the national level, including through exports. In fact, the inclusion of own-consumption and informal trade in the economic estimates indicates the significant contribution of pastoralism to the improvement of household incomes and to poverty reduction.
Furthermore, the results of the RGE and of the surveys argue convincingly in favour of the development of pastoralism as a viable means of improving the socio-economic conditions of the population. By investing in the dairy/meat and leather value chains, including training, infrastructure, processing units and distribution in a fair and inclusive manner, pastoralism has the potential to improve the income levels of the population and to considerably boost the economy.
6.2 Policy implication
- Integrate informal pastoral flows into the national accounts: The revision of the national-accounts methodology to include own-consumption (valued at market prices) and informal cross-border flows is a priority in order to correct the structural underestimation of the sector.
- Update the general censuses: Deploy large national surveys based on mobility-specific methodologies (e.g. sample surveys at water points or key markets).
- Integrate non-market values into GDP: Include own-consumption, the use of by-products (hides, fertilizer) and the ecosystem services provided by pastoralism in the national accounting.
- Modernize the border control posts: Install weighing infrastructure and digital recording systems to capture the real export flows.
- Digitize transhumance monitoring: Use geolocation and community platforms to map numbers and anticipate livestock movements.
- Develop regional partnerships: Collaborate with regional institutions, such as the Permanent Inter-State Committee for Drought Control in the Sahel (CILSS) and FAO, to harmonize the collection of cross-border data.
- World Bank, Report on the marketing opportunities for livestock and their products, Chad, February 2022.
- AfDB, Project to Support the Productivity and Competitiveness of the Meat and Milk Value Chains in Chad (PAPCV-VL) - Chad, Appraisal report September 2021
- International Conference on Agriculture, Pastoralism and Protected Areas, N’Djamena 2-4 October 2024, Report.
- ECA ( Economic Commission for Africa (estimate) )
- Assessment of the potential for improving the cultivated fodder available in the six (6) PRAPS countries (Burkina Faso, Mali, Mauritania, Niger, Senegal, Chad) National report Chad.
- FAO. 2020. Estimation of fodder balances in the Sahel region of West and Central Africa. Under the direction of Assouma, M.H. and Mottet, A. FAO: Animal Production and Health – Guidelines no. 22. Rome. <https://doi.org/10.4060/ca9111fr> .
- Guindé M., Ouagal M. and M. Abdallah. 2018. The importance of pastoralism in Chad. OIE, France: Paris. Panorama Bulletin 2018: 2. 36 - 39.
- Hiernaux P., Abdraman M. A., Béchir A. B., Passiring K., 2021. Diversity of pastoral practices, mobilities and adaptation trajectories of pastoral and agropastoral systems to change. IRAM-ACCEPT Report, 101 p
- ME, Pastoral System Securing Programme (PSSP), Study on pastoral societies, synthesis report, 2002
- MEPA, General Livestock Census (RGE), 2016. Final results
- MEPA, 2008. National Livestock Development Plan (PNDE1), 2009-2016
- MEPA, 2017. National Livestock Development Plan (PNDE2), 2017-2021
- MEPA, Directorate of Livestock Census and Statistics, Report, 2025 (not publicly available)
- Pastoralism in Chad, a potential to be developed thanks to responsible and structuring investments, FAO, https://openknowledge.fao.org
- World Bank (Njinkeu, D. et al.) (2024). Chad's Livestock. Washington, DC: World Bank. hdl:10986/41805
| Year | Cattle | Sheep | Goats | Camels | Equines | Asses | Total livestock |
|---|---|---|---|---|---|---|---|
| 2,015 | 24,892,098 | 26,436,170 | 30,519,349 | 6,413,521 | 1,073,498 | 2,804,210 | 92,138,846 |
| 2,016 | 26,213,239 | 28,530,729 | 32,405,495 | 6,835,700 | 1,119,276 | 2,989,319 | 98,093,758 |
| 2,017 | 27,604,500 | 30,791,242 | 34,408,208 | 7,285,669 | 1,167,006 | 3,186,647 | 104,443,272 |
| 2,018 | 29,069,601 | 33,230,856 | 36,534,693 | 7,765,258 | 1,216,772 | 3,397,001 | 111,214,181 |
| 2,019 | 30,612,462 | 35,863,764 | 38,792,597 | 8,276,416 | 1,268,659 | 3,621,240 | 118,435,138 |
| 2,020 | 32,237,210 | 38,705,279 | 41,190,044 | 8,821,223 | 1,322,760 | 3,860,282 | 126,136,798 |
| 2,021 | 33,948,191 | 41,771,929 | 43,735,656 | 9,401,892 | 1,379,167 | 4,115,103 | 134,351,938 |
| 2,022 | 35,749,982 | 45,081,553 | 46,438,592 | 10,020,784 | 1,437,980 | 4,386,746 | 143,115,637 |
| 2,023 | 37,647,402 | 48,653,400 | 49,308,574 | 10,680,415 | 1,499,301 | 4,676,319 | 152,465,411 |
| 2,024 | 39,645,528 | 52,508,248 | 52,355,925 | 11,383,468 | 1,563,237 | 4,985,008 | 162,441,414 |
| 2025 | 41,749,703 | 56,668,519 | 55,591,608 | 12,132,800 | 1,629,899 | 5,314,074 | 173,086,603 |
| DRSE, MEPA, 2025. | |||||||
The table below shows the synthetic chronology of the main climatic, ecological, sanitary and political shocks that have upended pastoral livestock keeping in Chad from its independence in 1960 to the present day.
| Period / Years | Major shocks | Nature of the shock | Major impacts on pastoral livestock keeping |
|---|---|---|---|
| 1969 - 1973 | Great Sahelian drought | Climatic | • Massive decimation of the herd (loss of more than 40 to 60% of cattle). • Beginning of the profound modification of the traditional transhumance routes toward the humid south. • Brutal impoverishment and forced sedentarization of the first waves of pastoral families. |
| 1979 - 1985 | Civil wars and the 1983-1984 drought | Political / Military / Climatic | • Total insecurity hampering the free circulation and strategic mobility of herds. • Second great pastoral famine (1984) provoking a new slaughter of animals. • Loss of control over the historic transhumance corridors. |
| 1982 - 1983 | Rinderpest epizootic | Sanitary | • Devastating mortality within the herds of unvaccinated cattle. • Collapse of the family economy of herders and of on-the-hoof meat exports. |
| 1990 - 2000 | Demographic pressure and the agricultural front | Socio-economic | • Shrinking of the transhumance corridors by the extension of cultivated fields in the South. • Emergence of the “neo-herders” (urban or military investors owning immense herds) destabilizing traditional pastoralism. |
| 2003 - 2010 | Darfur crisis and rebellions in the East | Geopolitical | • Massive influx of refugees and of Sudanese livestock in eastern Chad. • Generalized overload of pastures and exhaustion of local water points. • Resurgence of large-scale livestock theft by armed bands. |
| 2010s | Cross-border insecurity (Boko Haram / Lake Chad Basin) | Security | • Closure of commercial borders with Nigeria and Cameroon. • Loss of access to the rich pastoral fallback zones of Lake Chad. • Drastic fall in on-the-hoof livestock prices for lack of export outlets. |
| 2014 - 2016 | Institutional crisis of the Pastoral Code | Legal / Political | • Withdrawal of the draft Pastoral Code in 2014 following sharp political tensions. • Persistence of legal vagueness around land rights and resource access for nomads. |
| 2019 - 2022 | Covid-19 pandemic and Ukrainian crisis | Global sanitary / Economic | • Blockage of livestock markets and mobility restrictions during the lockdowns. • Surge in prices of supplementary livestock feed and of veterinary inputs. |
| 2021 - to date | Acceleration of climate change and bloody agropastoral conflicts | Climatic / Social | • Rise in extreme temperatures (>45°C), accelerated drying of the wadis and unpredictable violent floods. • Growing and forced sedentarization of herders from the North toward the South. • Explosion of increasingly deadly agropastoral conflicts over the control of water and land. |
| NB: The evolution since 1960 shows a progressive transition: Chadian pastoral livestock keeping has moved from crises that were mainly climatic and cyclical (great historic droughts) to complex structural crises mixing regional insecurity, violent land pressures and permanent climatic disruption. Despite these shocks, this mobile system remains the main provider of wealth of the Chadian rural sector. | |||
| Year | Cattle | Sheep | Goats | Camels | Equines | Asses | |
|---|---|---|---|---|---|---|---|
| 2023 | 33,275 | 2,451 | - | 70 | - | 919 | - |
| 2024 | 91,304 | 8,659 | 755 | 2,243 | - | 1,303 | - |
| 2025 | 33,652 | 4,005 | - | 1,660 | - | 601 | - |
| Total | 158,231 | 15,115 | 755 | 3,973 | - | 2,823 | - |
| DRSE, MEPA, 2025 | |||||||
| Species | 2023 | 2024 | 2025 |
|---|---|---|---|
| Cattle | 27,789 | 147,654 | 444,858 |
| Camels | 2,845 | 9,002 | 12,942 |
| Sheep | 52,413 | 267,018 | 579,134 |
| Goats | 39,031 | 176,103 | 334,225 |
| Horses (equines) | - | - | - |
| Donkeys (asses) | - | - | - |
| DRSE, MEPA, 2025 | |||
[1] The 80% figure refers to herds under pastoral and agropastoral systems combined; RGE 2018 records 26.3% of herds under strictly mobile systems (transhumant 12.8% + nomadic 13.5%), the balance being sedentary/agropastoral.
[2] Source and year to be confirmed by the author
[3] Source and year to be confirmed by the author
Annex - Additional Content Not in Master-Template Structure
Moved here verbatim by the format pipeline: author sub-structure that is not part of the master template. Nothing has been deleted; reintegrate into the body above if desired.
2 National context and overview of livestock
Chad, a landlocked country in Central Africa, has an economy and geography marked by a strong dependence on natural resources and climate. It takes the form of a vast basin bordered by mountain massifs such as the Tibesti in the north (3,415 m). It covers 1.284 million km². Three major climatic zones can be distinguished from north to south:
- The Saharan zone (North): An arid desert covering half the country.
- The Sahelian zone (Centre): A semi-arid area suited to pastoral livestock keeping.
- The Sudanian zone (South): A humid tropical savanna where agriculture is concentrated.
Although oil dominates exports, the economy remains structurally agropastoral, occupying about 80% of the active population. The IMF projects 2026 GDP at around 23.5 billion dollars. The country faces major challenges of landlockedness and climatic vulnerability, ranking 190th out of 193 on the Human Development Index (HDI) in 2025.
As for agriculture, it is the bedrock of food security. The overall potential of arable land is estimated at 39 million hectares for all cropping systems combined, representing about 30% of the national territory. It is divided into two branches:
- Food crops: Millet, sorghum, maize and rice for local consumption.
- Cash crops: Cotton (historically the driver), gum arabic and groundnut, and today sesame with strong demand.
The sector remains predominantly rain-fed and little mechanized, which makes it sensitive to rainfall variability.
The livestock sector is a strategic pillar, often described as the country’s “second wealth” after oil, resting on a mobile pastoral system (transhumance) exploiting about 84 million hectares of rangelands, but the lack of infrastructure (wells, modern abattoirs, milk-processing plants) and the conflicts between farmers and herders over access to resources hold back its industrialization.