

At the macroeconomic level, Cameroon is classified as a lower-middle-income country and is one of the largest economies within the Economic and Monetary Community of Central Africa (CEMAC). According to the National Institute of Statistics (INS) of Cameroon, the country's nominal Gross Domestic Product (GDP) reached 32,316.2 billion FCFA ($53.3 billion USD) in 2024, up from 29,609.4 billion FCFA in 2023. Measured in chained volumes (real GDP), economic output stood at 25,664.4 billion FCFA. This represents a real growth rate of 3.5% in 2024, a slight acceleration from the 3.3% recorded in 2023.
This momentum was heavily supported by the primary sector, which accelerated by 3.6% up from 2.3% in 2023 driven by a 9.5% expansion in industrial and export agriculture, largely due to sharply rising global cocoa prices. Conversely, the secondary sector remained slow, growing at just 1.7% as a consequence of a severe 9.7% contraction in hydrocarbon extraction, including crude oil and natural gas production. Meanwhile, domestic structural improvements in electrical power generation and distribution maintained a steady growth path of 3.7%.
On the financial front, domestic inflation decelerated significantly, falling from a peak of 7.4% in 2023 down to 4.5% in 2024. This trend aligns with regional monetary interventions by the Bank of Central African States (BEAC) and is projected to fall below the 4% threshold, establishing a safer environment for medium-term fiscal trajectories. However, public debt sustainability remains under careful surveillance due to liquid-asset stress thresholds, even as nominal GDP expansions help optimize public debt ratios.
From a microeconomic perspective, the everyday economic fabric of Cameroon is defined by structural disparities and a large informal labor sector. While nominal GDP per capita sits at roughly $1,467, wealth distribution remains highly unequal, as reflected in a persistently high Gini coefficient of 42.2. National data compiled in the World Bank Economic Update points to stagnant domestic poverty rates, with rapid population growth expanding the absolute number of individuals living in extreme poverty to over 6.6 million.
Households face recurring microeconomic pressures, notably constrained access to formal credit markets, geographic vulnerabilities stemming from regional security disruptions, and extreme commodity volatility. This is particularly visible in the consumer market, where private consumption final spending faced a domestic price inflation rate of 4.6% through 2024, directly impacting household purchasing power.
Covering an area of approximately 475,000 square kilometers at the intersection of West and Central Africa, Cameroon is characterised by its exceptional geographical, climatic, and ecological diversity. The country's topography ascends from low-lying coastal plains with mangrove ecosystems into the undulating hills of the South Cameroon Plateau, before climbing into the rugged Western High Plateau marked by the active volcano of Mount Cameroon (4,095 m) and the high-altitude Adamawa Plateau, which serves as the nation's primary watershed before dropping into the semi-arid northern lowlands. This diverse terrain organizes a dense river network into four major hydrographic basins (Atlantic, Niger, Congo, and Chad) driven by vital waterways like the Sanaga and Benue rivers.
Environmentally and economically, Cameroon is divided from south to north into five distinct Agro-Ecological Zones governed by a strict rainfall gradient:
- the Bimodal Rainforest Zone of the interior plateau specializing in timber and cocoa;
- the ultra-humid Monomodal Rainforest Zone along the coast hosting massive agro-industrial estates for rubber and palm oil;
- the fertile Western Highlands Zone driving food-crop and Arabica coffee production;
- the High Guinea Savanna Zone of the Adamawa Plateau acting as the premier hub for livestock ranching; and
- the semi-arid Sudano-Sahelian Zone in the far north focusing on drought-resilient millet, sorghum, and cotton.
Agriculture serves as the structural backbone of Cameroon's economy by employing 60% to 70% of the active workforce. In 2024, the nominal value of this sub-sector generated a historic total of 3,564.7 billion CFA francs. These major economic performances directly support the overall growth of the national gross domestic product. Additionally, agricultural activity accounts for approximately 30% of total revenues derived from commercial exports. This strategic sector thus establishes itself as the major stabilizer of the country's foreign exchange reserves.
The rural landscape is clearly divided between large export industries and small family-run farms. Industrial estates focus heavily on the cultivation of cocoa, coffee, cotton, and palm oil. In contrast, family micro-farms focus on subsistence food production for domestic food markets. Geographical distribution varies by climatic zones, contrasting northern cereals with southern starchy tubers. This production duality strongly structures territorial occupation and the food supply of major urban centers.
The utilization of space remains highly unbalanced since less than 30% of arable land is cultivated. The West and South-West regions show extreme land saturation exceeding 80% capacity. Conversely, the North and North-West retain immense reserves of cultivable land that remain untapped. Historical agricultural expansion unfortunately relies on increasing surface areas rather than improving technical yields. Producers suffer from a glaring lack of rural financing and modern mechanization equipment.
The National Development Strategy (SND30) aims for an accelerated structural transformation through aggressive agro-industrialization. The government strongly encourages local processing of raw materials to reduce dependence on imports. This model promotes the "Made in Cameroon" label to efficiently feed food processing industries. This dynamic necessarily integrates the livestock sector as an essential complementary socioeconomic pillar. The joint use of crop residues and manure sustainably strengthens the global resilience of countryside communities.

According to the National Institute of Statistics (INS) of Cameroon, the livestock sub-sector represents a resilient and accelerating pillar of the primary economy. In 2024, the "Livestock and Hunting" branch experienced a dynamic volume growth rate of 4.8%, up from 4.3% in 2023. This acceleration was primarily sustained by targeted institutional support, the improved distribution of veterinary inputs across production basins, and government interventions. Data extracted from the 2024 National Accounts provides a precise breakdown of the sub-sector's economic weight:
- Gross Value Added (Current Prices): 730.3 billion FCFA in 2024, showing a notable nominal expansion from 651.4 billion FCFA in 2023 (INS 2024).
- Gross Value Added (Constant 2016 Prices): 573.7 billion FCFA.
- Share of Total Agricultural Sector GDP: 12.24% of agricultural sector (valued at 5,966.1 billion FCFA).
- Share of National Gross Domestic Product: 2.26% of Cameroon's total national gross domestic product
- Net Contribution to Real GDP Growth: Stable at 0.1 percentage point per annum over a multi-year trajectory spanning from 2019 to 2024.
(Sources: INS Cameroon National Accounts Report)
From a broader microeconomic and livelihood perspective, structural reviews from the Food and Agriculture Organization (FAO) and historical reporting by the Ministry of Livestock, Fisheries and Animal Industries (MINEPIA) indicate that this economic activity directly supports over 30% of the rural population. The sector serves as a crucial metric for evaluating state performance under the National Development Strategy (SND30), which targets specific thresholds for meat and dairy volumes to eliminate food insecurity and capture regional export networks. According to MINEPIA's statistical reporting, the national annual output for meat and edible offal reached 347,907 tonnes. This volume was structurally led by beef at 37.4% (130,169 tonnes), followed by small ruminants including goats (11.1% or 38,564 tonnes) and sheep (7.4% or 25,649 tonnes). Additionally, sub-sector outputs yielded 176,618 tonnes of dairy milk.
Despite its strategic importance, measuring the exact impact of livestock within Cameroon's national accounts is constrained by significant data gaps and statistical limitations:
- The current methodology employed by the National Institute of Statistics merges Livestock and Hunting into a single composite economic indicator branch. This structural blending creates an analytical distortion, masking the standalone commercial performance of industrial animal production and pastoral husbandry.
- A vast portion of Cameroon's cattle trade operates within informal, unrecorded networks. Traditional transhumant pastoralism involves fluid cross-border migrations between Cameroon, Chad, the Central African Republic, and Nigeria. For example, while 49,606 head of cattle were formally recorded as imports from Chad (accounting for 8% of documented animals in herd movements), a significant percentage of livestock exchanges occur outside corporate supply chains, causing these figures to be heavily underestimated in official GDP dashboards.
- Official statistical assessments by MINEPIA recognize that field-level statistical units only partially capture real production. Regional delegations capture varying fractions of localized yields. For instance, technical estimations show that only 8.15% of inland capture fisheries data is directly recorded by field staff, and 23.6% of artisanal maritime captures are caught through the FAO's ARTFISH sampling framework. To adjust for these severe systemic underestimations, MINEPIA applies calculated historical correction coefficients to approximate true national macroeconomic outputs.
- Macroeconomic growth projections heavily rely on mathematical extrapolations from historical baseline surveys (such as the specialized livestock production and slaughterhouse survey conducted in 2016) rather than real-time census data. Technical equations for offal rely on rigid FAO conversion multipliers applied to carcass weights (7.7% for cattle, 8.3% for sheep, and 10% for goats). These models fail to seamlessly integrate sudden environmental or macroeconomic shocks, such as the acute localized disruptions during severe dry seasons (pastoral lean periods/soudure) in the North and Far North regions or abrupt price fluctuations in commercial inputs.
To provide policymakers with accurate economic insights to guide state planning under the National Development Strategy (SND30), the following statistical reforms are proposed.
- Disaggregate the Branch Indicators: Structurally decouple hunting from animal husbandry within the INS national accounting framework. This will isolate livestock GDP and allow distinct monitoring of specific livestock investments (e.g., dairy vs. extensive cattle).
- Digitalize Border Posts and Markets: Deploy mobile-based digital registry networks across traditional transhumance corridors and MINEPIA-monitored veterinary sanitary checkpoints (Postes d'Inspection Sanitaire Vétérinaire), such as the active transit tracking hubs located at Ekombitié. Digitally recording the volume and estimated value of live animal trade at international borders will capture informal revenues and improve export tracking.
- Conduct a General Census of Agriculture and Livestock (RGAE): Finance and fully implement the planned General Census of Agriculture and Livestock (Recensement Général de l'Agriculture et de l'Élevage). Replacing decade-old baseline assumptions with actual field statistics will bridge the gap between formal macroeconomics and the rural economy.
| Indicator | Value | Year | Official National Source | Technical Notes & Reference Details |
|---|---|---|---|---|
| National GDP (current USD) | $53.30 Billion | 2024 | INS Cameroon (Comptes Nationaux de 2024) | Calculated from the official 32,316.2 billion FCFA nominal GDP using the standard INS annual average exchange rate |
| Agriculture % of GDP | 11.03% | 2024 | INS Cameroon (Comptes Nationaux de 2024) | Represents crop agriculture specifically (3,564.7 billion FCFA out of 32,316.2 billion FCFA total GDP). The overall primary sector is 18.46%. |
| Agriculture GDP (current USD) | USD 5.88 billion | 2024 | INS Cameroon (Comptes Nationaux de 2024) | Derived: USD 53.30 bn × 11.03% agriculture share (INS 2024). |
| Livestock % of GDP | 2.26% | 2024 | INS Cameroon (Comptes Nationaux de 2024) | Derived directly from the official national account table. The Livestock and Hunting branch generated 730.3 billion FCFA. |
| Livestock % of Ag GDP | 12.24% | 2024 | INS Cameroon (Comptes Nationaux de 2024) | Calculated directly from official INS Table 4 data: 730.3 billion FCFA (Livestock) divided by 5,966.1 billion FCFA (the agricultural/primary sector, INS 2024) |
| Livestock GDP (current USD) | $1.20 Billion | 2024 | INS Cameroon (Comptes Nationaux de 2024) | Derived by converting the nominal livestock output of 730.3 billion FCFA at the 2024 national currency baseline. |
| Total Cattle Population | 10,929,032 head | 2023 | MINEPIA Cameroon (Annuaire Statistique) | Official Census Figure. Replaces lower FAO estimates. Heavily concentrated in the Adamawa Region (6,386,900 head). |
| Total Sheep Population | 4,171,371 head | 2023 | MINEPIA Cameroon (Annuaire Statistique) | Official Census Figure. Concentrated primarily in the Far North Region (1,788,545 head) |
| Total Goat Population | 7,292,703 head | 2023 | MINEPIA Cameroon (Annuaire Statistique) | Official Census Figure. Sourced from Table 19. The Far North holds the largest regional herd (2,923,312 head) |
| Total Camel Population | 714 head (Dromedaries) | 2021 | MINEPIA Cameroon (Annuaire Statistique) | Sourced from MINEPIA Table 27 ("Cheptels suivis de camélidés"). Highly localized in the Far North (239 head) and North (649 head) |
| Pastoral/Pastoralist Population | ~2.50 Million | 2025 | World Bank / MINEPIA Pastoral Framework | Tracks ancestral pastoral communities, mainly ethnic Mbororo and Fulbe herders concentrated along northern and western rangelands. |
| % of Population Pastoral | 10.0% – 13.0% | 2025 | BUCREP / Demographic Structural Surveys | Calculated relative to Cameroon's total demographic grid across major cattle-producing agroecological zones. |

The livestock sector represents a vital pillar of Cameroon's rural economy, providing direct livelihood and income for approximately 30% of the rural population. The primary sector contributes 18.46% of national Gross Domestic Product (GDP), of which the livestock and hunting branch represents 12.24% (INS 2024). The production landscape is structurally divided between ruminant grazing frameworks, whose management styles are strictly dictated by biophysical characteristics across the country's five distinct agro-ecological zones.
2.3.1 Pastoral / Traditional Nomadic System
This is an extensive, low-input system geared toward livestock herd survival, social status, and familial subsistence rather than commercial transactions. True nomads operate with no permanent homestead, maintaining a constant year-round migration pattern determined by natural grazing resource availability and surface water access. Conversely, the transhumant sub-type features seasonal displacements where herds travel to dry-season grazing floodplains and return to permanent sedentary bases during the wet season.
This traditional baseline is highly vulnerable to political boundary constraints and shrinking pasture zones, leaving communities exposed to agro-pastoral resource conflicts and severe animal tsetse or tick-borne parasites.
2.3.2 Agro-Pastoral System
This system serves as a sedentary transitional setup where animal husbandry remains the primary source of household income and economic security. Crop cultivation is integrated as a secondary activity to safeguard household food security, allowing historically mobile herding groups to gradually settle and establish permanent village structures.
2.3.3 Mixed Crop-Livestock System
An integrated, complementary system where crop production and small-scale livestock rearing coexist within a single family farm unit. Ruminant animals roam village perimeter areas during the rainy season but are kept in stalls or paddocks during the dry season height, where they are intensely fed agricultural crop residues, including groundnut stover, maize husks, and sorghum stalks. In return, livestock supply essential organic manure to rebuild soil fertility in intensive agricultural plots.
2.3.4 Intensive and Peri-Urban System
A highly commercialized, high-input system located on the periphery of major metropolitan markets to satisfy urban food demands. It features modern animal housing, strict veterinary control, and zero-grazing feeding regimes.
Focuses on commercial dairy production utilizing pure exotic breeds or crossbred dairy cattle to supply urban milk processing networks.
2.4 National Herd Management and Market Architecture
2.4.1 Ruminant Herd Distribution
- Pastoral / Traditional Nomadic System: This extensive, low-input system handles 50.6% of the national cattle herd (denominator: total national bovine population). It peaks across the Guinea savannah and Sahelian rangelands. True nomads maintain a constant year-round migration pattern determined by water access, while transhumant herders execute seasonal movements. Both groups are highly exposed to shrinking pasture zones and agro-pastoral conflicts.
- Agro-Pastoral and Mixed Crop-Livestock Systems: These systems collectively manage 45.6% of the national cattle herd (denominator: total national bovine population) and over 75% of small ruminants (denominator: total national sheep/goat populations). Concentrated in the Far North, North, and Western Highlands, these models integrate crop cultivation with livestock rearing. Animals are fed agricultural residues during the dry season, and in return, they supply vital organic manure to restore soil fertility.
- Intensive and Peri-Urban Commercial System: This high-input, commercial framework accounts for the remaining 3.8% of the national bovine population (denominator: total national bovine population). It focuses on modern dairy production utilizing pure exotic breeds or crossbred cattle to supply urban processing networks.
2.5 Key Pastoral Groups and Geographic Distribution
2.5.1 Sahelian and Sudan Savannah Zone (Far North and North Regions)
Fulbe (Fulani), Bororo, Arab herders (Makari), and sedentary Matakam communities. Extensive transhumance dominates this open, arid savannah zone. Arab herders near Lake Chad orchestrate complex wet-season migrations across national borders to bypass tsetse fly infestations and seasonal floods. In the Diamaré division, herders execute seasonal movements to prevent animal crop damage in intensive farming areas. Matakam agropasteurs in the Mandara mountains utilize a specialized mixed system, stall-feeding single bulls with crop residues for cultural festivals.
2.5.2 Guinea Savannah and Highland Plateau Zone (Adamaoua, North West, and West Regions)
Settled Bororo herders, Bamileke farmers, and Tikar agropasteurs. The Adamaoua plateau holds 83% of Cameroon's extensive cattle population, primarily the indigenous Adamawa Zebu (Gudali). High land pressure in the Western Highlands has accelerated a shift toward mixed crop-livestock farming, where farmers utilize paddock fencing and agricultural by-products to feed dairy cattle.
2.5.3 Equatorial Rainforest Zone (Centre, South, Littoral, and South West Regions)
Sedentary agricultural populations, including the Beti, Bulu, Fang, Bassa, and Douala ethnic groups. High humidity and tsetse fly vectors limit large ruminant production to less than 5% of the national total. Ruminant production relies on trypanotolerant small ruminants like the West African Dwarf goat and Djallonké sheep managed under village scavenging setups.
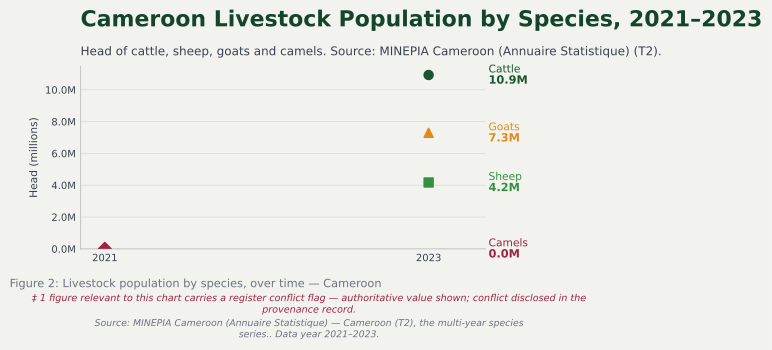
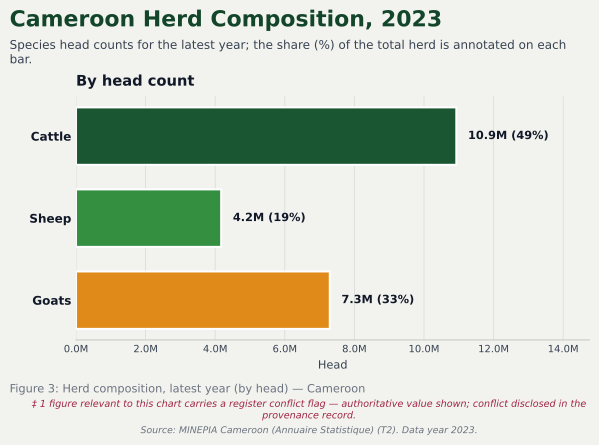
The livestock population in Cameroon maintains a long-term upward trajectory across most major species, driven by growing national demand for animal proteins. Official data compiled by the Ministry of Livestock, Fisheries and Animal Industries (MINEPIA) underscores that livestock farming serves as a cornerstone of the primary sector's contribution to the national economy.
National inventory metrics from MINEPIA's statistical registry highlight distinct annual growth patterns and structural fluctuations across Cameroon's primary animal value chains:
- Cattle (Bovines): This sub-sector recorded the most substantial absolute growth, expanding from 7,456,123 heads in 2016 to 10,929,032 heads in 2023. Cattle herding remains heavily anchored within specific agro-ecological zones, led by the Adamaoua region (5.43 million heads in 2022) and the Extrême-Nord region (1.96 million heads in 2022).
- Small Ruminants (Goats and Sheep): Caprines consistently outnumber ovines across Cameroon. Goats grew moderately from 6,365,528 in 2016 to 7,292,703 in 2023. Sheep followed a parallel positive trend, rising from 3,283,086 to 4,171,371 heads over the same timeframe. The Extrême-Nord region remains the undisputed epicenter for small ruminants, sheltering 4.81 million goats and 2.52 million sheep in 2022.
Most Recent Livestock Survey and Methodological Quality
The baseline data for Cameroon's current livestock estimations stems from a specialized national livestock survey executed by MINEPIA in 2016. This field diagnostic evaluated multi-regional animal slaughters, commercial day-old chick production, honey extraction, and dairy yields.
While these datasets are vital for institutional decision-making, users must navigate significant methodological limitations and data quality concerns:
- Data Capture Constraints (Technique de Captage): MINEPIA's standard reporting relies on a bottom-up data pipeline where local Zootechnical and Veterinary Centers (CZV) collect raw community metrics, routing them through Sub-divisional (arrondissement), Divisional (départemental), and eventually Regional Delegations. This administrative pipeline captures only a fraction of true national asset volume due to a massive informal market footprint and unmonitored cross-border trade corridors.
- Application of Static Correction Coefficients: To bridge the gap between field logs and actual volumes, the Ministry calculates specific correction coefficients derived from the 2016 sample survey data. These coefficients are mathematically applied as denominators to current regional data compiles. This methodology operates on the strict assumption that the rate of data under-evaluation by field services remains stable over the short and medium term. If field infrastructure shifts or trading dynamics change, the model's accuracy degrades.
- Spatial Incompleteness and Data Gaps: As officially stated by MINEPIA's statistical bureau, the sub-sector struggles with low spatial completeness and missing variables. This is exacerbated by communication bottlenecks within decentralized territorial services, as well as an inability to systematically document cross-border transhumance and backyard slaughters.

Livestock rearing serves as an essential economic driver, safety net, and wealth builder for rural Cameroonian families. The sector directly employs approximately 30% of the rural workforce. Around one-third of all Cameroonian households operate directly within the livestock sector.
Empirical data reveals that average livestock income accounts for exactly 30% of total household income across farming families, tracking at an average of 316,682 FCFA per household annually. The profound microeconomic impact of this sector is demonstrated by its role in poverty alleviation; a minor 1% decrease in household livestock income triggers an immediate 0.043 percentage point increase in the national poverty headcount, alongside severe drops in depth and severity indices. For households living below the poverty line, livestock serves as the primary financial mechanism to overcome systemic economic shocks.
a. Monetary Income Generation
Commercial sales of live animals and sub-products provide direct household liquidity to pay for basic food staples, family healthcare, and children's school fees.
Live Cattle and Beef Value Chains
- Household Income Share: Livestock income dominates the northern regions. It provides 95% of family income in the Adamaoua and Northern regions.
- Commercial Demands: Cattle herds are reared primarily for commercial trade. Over 71.2% of rural herds are dedicated to market supply.
- Urban Consumption Pull: Urban demands drive heavy commercial flows. Yaoundé slaughters 2,000 to 3,000 cattle on a single main market day.
- Asset Valuation: Live beef cattle command high values. They average 106,444 FCFA per animal, while dairy cattle average 117,893 FCFA.
- Urban Butchery Margins: Downstream operators secure reliable returns. Urban butchers net 52,700 FCFA per carcass, and small retailers net 43,500 FCFA per 64 kg quarter.
Dairy Sector and Gendered Income
- Daily Cash Flow: Smallholder dairy provides regular cash. Holstein cows in the Western Highlands produce 12.83 liters daily.
- Value-Added Returns: Processing raw milk (400 FCFA/liter) into yogurt (1,000 FCFA/liter) dramatically inflates profit margins.
- Large-scale Processors: Net 230,100 FCFA monthly profit. They buy neighborhood milk at 300 FCFA/liter for yogurt processing.
- Small-scale Producers: Pocket a modest 33,800 FCFA monthly profit selling raw, unprocessed milk.
- Gender Financial Control: Milk sales empower rural women. Women manage manual milking and micro-retail, gaining financial control over domestic purchases.
Smallholder Small Ruminant Sales
- Sheep and Goat Offtake: Small ruminants supply critical seasonal cash. Production in 2024 stood at 27,671 tonnes for sheep and 38,827 tonnes for goats. Sales spike significantly during holidays like Tabaski, maximizing cash income for northern pastoral families. Goats and sheep command average market values of 26,453 FCFA and 28,322 FCFA per animal, respectively.
b. Non-Monetary and Informal Financial Assets
Beyond direct market sales, livestock serves as an essential financial asset, acting as capital insurance and physical farm support.
- Savings and Capital Accumulation: Live herds operate as a visible banking system. Smallholders store asset wealth in cattle and small ruminants to shield profits from inflation. The herd grows naturally through reproduction, generating wealth without formal banking systems.
- Insurance and Strategic Offtake: Livestock acts as a primary emergency buffer. When hit by crop failure, households liquidate small stock to manage deficits. Survey records highlight the key triggers for selling livestock:
- Urgent family needs: Accounts for 86.8% of animal sales.
- Social festivals and celebrations: Triggers 79.2% of household off-take.
- Children's school tuition: Compels 67.9% of smallholder transactions.
- Medical emergencies and accidents: Prompts 66.0% of immediate animal liquidations.
- Intergenerational Wealth Transference: Livestock anchors local social customs. In pastoral communities like the Mbororo and Fulani, cattle serve as standard dowry payments. Crucially, a heifer calf (vêle) is traditionally gifted to an infant at birth. This long-standing custom secures the child's future wealth and provides early financial training in herd management.
- Draft Power and Agricultural Traction: Cattle serve as essential mechanical capital in the northern agricultural belts. Oxen are used to plow cash and food crops, helping households expand their cultivated land and lower manual labor requirements.
Organic Fertilization (Manure): Mixed crop-pastoral farms rely heavily on animal manure for soil fertility. This organic substitute shields farmers from volatile chemical fertilizer prices, lowering crop production costs and stabilizing agricultural margins.
c. Micro-Financing via Rotating Savings (Tontines)
Because formal banks rarely grant agricultural credit to smallholders, livestock income feeds informal credit networks.
- ROSCA Integration: Dairy and cattle revenues fund traditional rotating savings associations (tontines).
- High Participation Rate: Over 88.31% of dairy smallholders actively participate in tontine savings circles.
- Weekly Capital Pooling: Large dairy processors contribute 10,000 FCFA weekly, while small-scale raw milk sellers save 3,000 FCFA per week.
- Socio-Economic Reinvestment: These accumulated sums provide key financial backing. Farmers use their payouts to purchase dairy supplements, cover school tuition, and secure family healthcare.
d. Constraints to Income Stability
Several challenges undermine livestock income security:
- Agro-pastorales Conflicts: Land clashes threaten herd capital. Crop-pastoral conflicts disrupt production for 81.1% of herders in major grazing basins.
- Animal Theft: Chronic cattle rustling directly drains family assets. Theft impacts 70.8% of rural livestock operators.
- Market Intermediaries: Middlemen squeeze smallholder profits. High concentrations of brokers in urban stockyards reduce the direct margins left for butchers and traditional herders.
- Disease Vulnerability and Feed Costs: Expensive commercial feeds heavily threaten smallholder income stability.
- Income-Diversification Risk Spikes: While engaging in alternative, non-farm employment increases net household revenue by an average of 76,000 FCFA, spontaneous activity diversification significantly increases production variance and output risk for small enterprises.
The livestock sub-sector in Cameroon directly and indirectly absorbs over 30% of the rural and peri-urban labor force. To grasp its full macroeconomic role, employment figures must be broken down across the major animal value chain: Cattle (Ruminants).
The Cattle and Ruminant Value Chain
The cattle value chain dominates the geographical landscape of northern and western Cameroon, serving as the largest formal and informal rural employer.
- Direct Labor (Production & Husbandry): Pastoral production absorbs massive amounts of labor. The World Bank-backed Livestock Development Project (PRODEL) directly tracks and sustains over 38,350 dedicated pastoralists and herders. This footprint expands further when considering seasonal transhumance helpers and family laborers across the Adamawa, North, and Far North regions.
- Direct Labor (Trading & Intermediaries): Animal marketing employs thousands of specialized brokers (dilali), market masters, loaders, and security agents. Institutional efforts have constructed 16 modernized regional cattle markets under PRODEL, formalizing thousands of transactional and administrative roles.
- Indirect Labor (Logistics & Support): This chain supports a vast long-distance transport workforce. Fleets of multi-ton trucks carry cattle from northern collection points to major southern urban hubs like Yaoundé and Douala. This movement sustains networks of drivers, mechanics, roadside feed suppliers, and drovers. Additionally, the infrastructure supports public and private animal care roles across 160 local veterinary health facilities.
Livestock plays a dual role in rural resilience: it acts as a primary household safety net while remaining highly vulnerable to regional environmental shocks. Its capacity to absorb these crises depends heavily on the production system and agro-ecological zone.
a) Pastoral and Extensive Systems (Sudano-Sahelian Zone - Far North and North)
- The Safety Net Mechanism: In this hyper-arid belt, vegetation is sparse and crop production is highly volatile. Livestock functions as a mobile bank account. Families rely on herd mobility to find water and pasture, liquidating sheep and goats to buy grains when rains fail.
- Shock Exposure & Quantifiable Data: This zone bears the brunt of climate extremes. Severe dry spells impact roughly 1.2 million cattle annually, creating persistent health risks for the northern herd. Seasonal flash floods compound these challenges in low-lying river plains. Data from the Food and Agriculture Organization (FAO) Data in Emergencies (DIEM) highlights that 58% of livestock producers face systemic production bottlenecks, led by disease outbreaks and flood-related herd stress.
- Welfare Impact: When acute environmental disasters strike, asset loss damages family financial stability. Studies show that post-flood recovery forces over 50% of local households to restrict their daily food intake, driving families to take on an average of 95,000 FCFA in emergency debt to replace lost stock and buy food. Furthermore, water scarcity triggers localized resource conflicts over grazing rights, occasionally displacing populations and disrupting trade networks.
b) Agro-Pastoral and Mixed Crop-Livestock Systems (Guinean Savannah & Western Highlands)
- The Safety Net Mechanism: In the Adamawa and Western Highlands, farmers practice an integrated mixed crop-livestock system. This configuration creates a highly resilient recycling loop: animals feed on crop residues (maize stalks, groundnut hay), and in turn, provide organic manure to restore depleted farm soils.
- Shock Exposure & Quantifiable Data: While shielded from the extreme droughts of the far north, this system faces heavy pressure from animal disease vectors (such as trypanosomiasis/tsetse fly) and escalating land-use conflicts. High operating expenses also limit growth, with 44% of herders facing steep domestic transport and marketing fees that erode their profit margins.
- Welfare Impact: When disease outbreaks hit herds of small ruminants, smallholders lose their secondary income buffer. This vulnerability often forces families to sell off capital assets or reduce investments in school fees and modern crop fertilizers, showing how livestock health directly impacts overall family well-being.
The livestock sector is essential for combating chronic malnutrition and micro-nutrient deficiencies in Cameroon. However, domestic output faces structural pressures that limit regular access to animal proteins.
a) Value Chain Nutrition Contribution Matrix
According to Ministry of Livestock data, national livestock production volumes vary significantly across sectors, reflecting distinct supply realities:
| Livestock Value Chain | National Annual Production (Tons) | Dietary & Micronutrient Security Profile |
|---|---|---|
| Cattle & Beef | 130,169 Tons (37.4% of national meat and offal output; MINEPIA 2023) | Supplies the primary volume of domestic red meat. It provides highly bioavailable zinc and iron, which are essential for reducing anemia in rural women. |
| Small Ruminants (Goat/Sheep) | 64,213 Tons (goats 38,564 t and sheep 25,649 t; MINEPIA 2023) | Serves as a vital lean protein source in northern communities, where it is frequently slaughtered for local subsistence, religious celebrations, and fast cash. |
| Fresh Milk | 176,618 Tons | Acts as a daily nutritional staple for pastoralist children, helping protect vulnerable nomadic youth against early growth wasting. |
b) Macro Supply Realities and Food Security Disruptions
Despite steady gains in milk production, Cameroon's overall meat supply remains highly vulnerable to structural shocks. National production of meat and edible offal reached 347,907 tonnes in 2023, a 6% increase on the 327,000 tonnes recorded in 2022 (MINEPIA 2023). Domestic animal-protein availability nonetheless remains below global nutritional targets, particularly in fragile northern zones. Per-capita supply levels of meat and milk are not currently published for Cameroon in the cited sources; this is recorded as a data gap.
c) Livestock Ownership and Child Nutrition Outcomes
Owning livestock has a clear, measurable effect on family health and child development, balancing positive nutritional gains with sanitation challenges:
- The Dietary Diversity Advantage: Empirical nutrition data shows that integrated livestock ownership helps vulnerable families meet essential child health goals. Households with direct access to milk or meat are significantly more likely (Odds Ratio = 1.89) to achieve minimum dietary diversity targets. This regular access to animal-sourced foods helps reduce child stunting (chronic malnutrition) and wasting (acute malnutrition) in remote pastoral communities.
- The Biosecurity Counterweight: While livestock ownership improves nutrition, it introduces health trade-offs if farm sanitation is poor. Close proximity to animal pens can expose young children to zoonotic pathogens and fecal matter. Studies indicate that up to 79.5% of local health reports link traditional, unhygienic backyard keeping to elevated diarrheal risks in children. These recurring infections can cause environmental enteropathy a condition that impairs gut nutrient absorption and can reverse dietary gains. This risk underscores the vital need to pair livestock programs with clean water, sanitation, and animal biosecurity training.
1. Marketing Channels and Value Chains
Livestock marketing channels in Cameroon operate as a flow network where animals move from extensive northern breeding grounds to high-demand southern consumer centers.
- Cattle Chain Network: Cattle commercialization is highly structured around a web of interconnected livestock markets acting as operational nodes. Animals are purchased by traders at sub-regional or regional assemblies and moved step-by-step along the chain until they are sold at terminal urban hubs or cross-border points.
- Regional Integration: The domestic chain is highly integrated with neighboring markets. Long-distance, cross-border cattle routes create direct epidemiological and commercial connections with five neighboring countries, including Nigeria (e.g., Taraba State), Chad, and the Central African Republic.
Key Market Locations and Infrastructure
Cameroon's livestock landscape consists of 127 recognized marketing nodes heavily stratified between regional supply hubs and destination markets.
Major Marketing Locations
- The Adamawa Region: A pastoral highland hosting an official population of over 1.25 million cattle. It serves as Cameroon's primary livestock source hub and acts as a dry-season haven for transhumant herds moving from other northern zones.
- The Littoral and Center Regions: Terminal consumer nodes centered around the urban megalopolises of Douala and Yaoundé, acting as the major net receivers of livestock from across the country.
- The South Region: Delineated by strategic frontier nodes like Kyé-Ossi, which directly export livestock to Gabon and Equatorial Guinea.
- The North-West Regional Cluster: Highly cohesive and relatively isolated from the rest of the national network, meaning cattle primarily circulate within its internal municipal markets.
2. Market Infrastructure Quality
Marketing occurs within conventional open-air or fenced enclosures owned by the state and managed via local municipal councils and the Ministry of Livestock. Transactions are typically held weekly, though prominent urban terminal hubs operate up to six days a week. Infrastructure remains basic; transactions are documented on paper or recorded by hand. Up to 75% of local markets feature designated selling stalls, but modern processing facilities, transport vehicles, and structured cold storage zones are absent, forcing live-animal sales.
3. Offtake Rates and Price Dynamics
Offtake Rates
Commercial offtake rates are constrained by seasonal patterns, rudimentary management, and high mortality shocks.
- Cattle: Records show that over an annual aggregated period, approximately 252,831 individual cattle actively moved through the tracked market infrastructure.
Price Dynamics
- Flow Seasonality: Volume fluctuates predictably with regional pasture availability. More cattle are actively traded during the rainy season (April–August) when grass is abundant, leading to heavier, highly marketable animals.
- Festivity Spikes: A massive commercial volume spike occurs every December. Despite falling in the middle of the harsh dry season, traditional end-of-year behaviors and religious holiday celebrations rapidly increase consumer meat demand, driving livestock prices to their annual peak.
- Pricing Mechanics: Prices are determined via face-to-face bargaining influenced by sex and visual weight. Cattle prices are similarly unstandardized and based entirely on visual body condition.
4. Value Chain Actors and Their Roles
| Actor | Primary Function / Role within the Chain |
|---|---|
| Pastoralists & Smallholder Breeders | Reared on communal rangeland or via village free-roaming setups. In regions like Adamawa, smallholder livestock keeping is 85% dominated by men due to socio-cultural dynamics. This secondary activity handles core climatic production risks, covering 20% to 80% of basic household cash expenses. |
| Traders & Intermediaries (Buy'm sell'm) | Act as the primary commercial connectors. Local brokers trade within a narrow, localized geographic area because most animal movement still happens on foot. Conversely, wholesale dealers assemble larger commercial batches at regional livestock hubs to truck down to terminal southern networks. |
| Processors & Butchers | Purchase live cattle or birds at urban terminal points, coordinate slaughtering at state-supervised or municipal abattoirs, and manage distribution to wet markets and institutional buyers. |
| MINEPIA & Veterinary Services | Government bodies responsible for managing official market registries, tracking livestock movements, and organizing vaccination campaigns. However, operational coverage is highly constrained; up to 87.5% of family livestock holdings in remote zones have never been visited by state veterinary services. |
Cameroon's cross-border and international livestock trade plays a complex role in national and regional food security. Formally, national policies emphasize trade substitution and import contraction to achieve strategic auto-sufficiency under the Stratégie Nationale de Développement (SND30). However, formal customs tracking catches only a fraction of actual activity. Long-distance commercial links operate as a "small-world" network where national borders represent no structural barrier to the massive flow of live animals across Central and West Africa.
5. Formal and Informal Trade Patterns
Formal Imports and Currency Constraints
In 2024, Cameroon imported a total of 228,952 tonnes of animals and animal-kingdom products. This represented a contraction of 12.1% in volume compared to 2023, which saw 260,115 tonnes imported. Financially, the total formal import bill dropped from CFAF 231.6 billion in 2023 to CFAF 208.4 billion in 2024.
- Frozen Fish Dominance: Frozen fish and crustaceans represent the largest expenditure, comprising 90.5% of the total volume and 80.5% of the financial value of formal imports (207,517 tonnes valued at CFAF 167.8 billion). The top suppliers are Mauritania (38,845 t), India (35,240 t), the Netherlands (20,672 t), and the United Kingdom (18,039 t). Cameroon's import dependency rate for fish sits at 45.8%.
- Dairy Inflows: Powdered and concentrated milk imports totaled 16,555 tonnes in 2024, valued at CFAF 33.16 billion, down slightly from 17,218 tonnes in 2023.
- Live Animals and Meat: Formal imports of live animals were heavily restricted, dropping 54.1% to 2,043 tonnes in 2024 (valued at CFAF 2.7 billion). Formal edible meat and offal imports accounted for a negligible 218 tonnes (valued at CFAF 324.8 million).
Informal Cross-Border Dynamics and Technical Underestimation
The official data compiled by the Ministry of Livestock, Fisheries, and Animal Industries (MINEPIA) presents a structural underestimation of trade. MINEPIA's statistical tracking captures only a fraction of real market flows; for example, regional technical services catch just 8.15% of inland continental catches. Live animal movements are recorded on paper, meaning seasonal, transboundary, and informal trade are omitted from customs values.
Informal movements are massive, driven by price differentials, porous frontiers, and traditional seasonal transhumance patterns. Livestock from landlocked Chad and the Central African Republic (CAR) flow seamlessly into Cameroon's northern regional clusters to meet domestic demand or transit to neighboring consumer nations.
Key Trade Corridors and Partners
Cameroon acts as a central regional transit hub for livestock trade within the Central African Economic and Monetary Community (CEMAC) and the Economic Community of Central African States (ECCAS).
The Chad–Cameroon Inflow Corridor
Chad is a major exporter of live animals to Cameroon. In 2023, tracked overland data showed that 49,606 head of cattle were directly imported from Chad, accounting for 8% of all cattle moving through the national tracking network. These animals enter via the Far North and North regions, moving south down transit highways or through transhumance routes into the Adamawa highland hub.
The Southern Transit Axis (Gabon & Equatorial Guinea)
Cameroon serves as a primary supply zone for forested Central African countries with low production capacity but high purchasing power.
- Cattle Flows: In 2023, at least 20,038 head of cattle cleared the strategic southern checkpoint of Ekombitié. This represented 3% of the entire national moving cattle herd.
- Small Ruminants: The southern corridor handles even higher proportions of sheep and goats. Over 40,565 small ruminants passed through the Ekombitié border controls, representing 14% of the nation's total small ruminant trade volume.
- Terminal Node: The frontier marketplace of Kyé-Ossi in the South Region serves as the terminal hub, channeling these animals directly into Gabon and Equatorial Guinea.
The Nigerian Frontier Axis
The Nigerian trade axis forms a highly integrated commercial network. The longest commercial path length across the entire Cameroonian livestock network maps from Chadian border inflows, across the Adamawa production zone, and ends at frontier markets in the North-West Region next to Taraba State, Nigeria. Large commercial components are bound to cross-border nodes, meaning animal diseases can spread rapidly over long distances across national lines.
Livestock Trade Summary Table
Values in local currency units (CFAF) are converted into US Dollars (USD) at a standard benchmark rate of 1 USD = 606 CFAF to facilitate standardized international comparison.
| Trade Flow | Value | Year | Formality | Key Partners | Source Document |
|---|---|---|---|---|---|
| Live Animal Imports | $4.51 Million (CFAF 2.70 Billion) | 2024 | Formal | Regional land borders (Neighboring herds) | MINEPIA Report 2024 |
| Live Cattle Imports (Overland) | 49,606 Head of Cattle | 2023 | Mixed Tracking | Chad | MINEPIA Report 2023 |
| Meat & Edible Offal Imports | $0.54 Million (CFAF 324.8 Million) | 2024 | Formal | International suppliers | MINEPIA Report 2024 |
| Dairy & Honey Imports | $62.54 Million (CFAF 37.52 Billion) | 2024 | Formal | Western Europe, Oceania, Global | MINEPIA Report 2024 |
| Fish & Crustaceans Imports | $279.79 Million (CFAF 167.87 Billion) | 2024 | Formal | Mauritania, India, Netherlands, UK | MINEPIA Report 2024 |
| Live Cattle Transit Exports | $1.62 million (20,038 Head of Cattle) | 2023 | Formal Tracking | Gabon, Equatorial Guinea via Kyé-Ossi | MINEPIA Report 2023 |
| Small Ruminant Exports | $0.15 million (40,565 Head of Sheep/Goats) | 2023 | Formal Tracking | Gabon, Equatorial Guinea via Ekombitié | MINEPIA Report 2023 |
| Informal Cross-Border Flows | Undocumented (Massive, structural gap) | 2026 | Informal | Nigeria (Taraba State), Chad, CAR, Congo | Motta et al., Scientific Reports |
The structural connection or disconnect between rural production basins and terminal commercial networks directly dictates the economic vulnerability, food security, and adaptive capacity of pastoral and agro-pastoral communities in Cameroon. By synthesizing the macroeconomic and microeconomic evidence detailed across the national livestock framework, this section analyzes how market access, structural barriers, pricing dynamics, and undocumented trade vectors interact to shape real world livelihoods.
Access to Markets, Income, and Livelihood Security
Market integration acts as the primary determinant for transforming biological assets (live herds) into disposable liquid capital for rural households. Across Cameroon's livestock-producing belts, empirical data shows that livestock income accounts for exactly 30% of total household income among farming families, averaging 316,682 FCFA annually. However, the security of this income is entirely dependent on a household's level of market integration.
The Northern Monopolization vs. Southern Pull
In the hyper-integrated cattle corridors of the Adamawa and Northern regions, livestock income represents a staggering 95% of total family revenue. Because 71.2% of rural herds are reared explicitly for commercial trade to supply major urban centers such as Yaoundé, which demands between 2,000 to 3,000 cattle on a single peak market day. Integrated pastoralists secure strong baseline valuations. Live beef cattle command high values averaging 106,444 FCFA per animal, while dairy cattle reach 117,893 FCFA.
Financial Buffers Against Extreme Poverty
This steady commercialization underpins structural rural resilience. A minor 1% drop in household livestock income triggers an immediate 0.043 percentage point surge in the national poverty headcount. For the 6.6 million Cameroonians living in extreme poverty, integrated animal sales provide immediate liquidity to buffer crop failures, pay children's school tuition (compelling 67.9% of transactions), and handle medical emergencies (prompting 66.0% of immediate liquidations).
Gender-Enabling Cash Flows
Market integration also restructures gendered financial control. In the Western Highlands and Adamawa, smallholder dairy integration allows Holstein crossbred cows to yield up to 12.83 liters of milk daily. Processing raw milk (worth 400 FCFA/liter) into value-added yogurt (retailing at 1,000 FCFA/liter) allows downstream actors to secure up to 230,100 FCFA in monthly profits. Because rural women traditionally manage manual milking and micro-retail channels, higher market integration directly empowers them, shifting disposable cash into domestic food and healthcare purchases.
Structural and Institutional Barriers to Market Access
Despite high production potential, pastoral communities face severe localized bottlenecks that fragment the value chain and strip producers of direct economic margins.
- Agro-Pastoral Land Conflicts: Severe land-use saturation and fragmentation particularly visible in the West (86.1% land utilization) and South-West (88.1%) regions have choked traditional grazing corridors. Crop-pastoral resource clashes disrupt production for 81.1% of herders in major grazing basins, cutting off safe pathways to physical assembly points.
- Asset Insecurity (Cattle Rustling): Chronic animal theft and rural insecurity directly drain family assets, impacting 70.8% of rural operators and forcing preemptive or distress sales in isolated zones where herders cannot safely protect their stock.
- The Middleman Bottleneck (Bana-Bana / Dilali): A high concentration of informal brokers and intermediaries in urban stockyards creates a marketing monopoly. These brokers insulate traditional pastoralists from direct consumer pricing. Consequently, while downstream urban butchers net 52,700 FCFA per carcass, unintegrated traditional herders are squeezed, capturing a disproportionately lower share of the animal's ultimate value.
- Extreme Logistical and Sanitary Costs: Rural transport remains highly punitive. Approximately 44% of herders face steep domestic transport and marketing fees that heavily erode thin profit margins. This is compounded by an absolute deficit in state-backed animal healthcare; 87.5% of family livestock holdings in remote zones have never been visited by state veterinary services, leaving herds fully exposed to devastating disease shocks.
Informal Trade and the Official Erasure of Pastoral Value
A massive proportion of Cameroon's livestock trade operates within fluid, unrecorded transboundary networks that bypass corporate supply chains and formal customs counters. This structural informality causes a severe analytical distortion in how pastoralism is recognized by national planners.
Macroeconomic Underestimation
The National Institute of Statistics (INS) currently merges "Livestock and Hunting" into a single composite economic branch. This structural blending generates 730.3 billion FCFA in nominal gross value added (accounting for 2.26% of total National GDP). However, this figure is a vast underestimation. Traditional transhumant pastoralists execute fluid, season-driven border crossings between Cameroon, Chad, Nigeria, and the Central African Republic.
- The Statistical Tracking Gap
While 49,606 head of cattle were formally logged as overland imports from Chad (comprising 8% of tracked national movements), millions of animal exchanges slip completely past veterinary sanitary checkpoints (Postes d'Inspection Sanitaire Vétérinaire). Field-level statistical units lack digital registry tools, capturing only minor fractions of regional yields (analogous to the tracking failures in inland fisheries, where only 8.15% of catches are formally recorded).
- Policy Neglect via Extrapolation
Because MINEPIA relies on rigid mathematical extrapolations from a baseline survey conducted a decade ago (2016) and static FAO carcass conversion multipliers rather than real-time census data, the true multi-billion CFAF cross-border trade remains invisible on official GDP dashboards. Consequently, because pastoralism's real fiscal weight is formally erased, it fails to attract proportionate public infrastructure budgeting such as the construction of gazetted cattle tracks, localized cold chains, or subsidized veterinary input networks under the Stratégie Nationale de Développement (SND30).
Market Price Dynamics and Pastoral Welfare
Because livestock represents a pastoralist's primary banking instrument to shield profits from inflation, market price volatility directly dictates household food and nutrition security.
Climatic and Seasonal Supply Squeezes
The Cameroonian livestock market is defined by a rigid south-to-north moisture gradient and erratic seasonal lean periods (soudure). During severe dry seasons in the Sudano-Sahelian zone (Far North and North), water and forage scarcity impacts roughly 1.2 million cattle annually. Data from the FAO Data in Emergencies (DIEM) registry highlights that 58% of livestock producers face systemic production bottlenecks due to climate stress. As animals emaciate, their market value plummets. Simultaneously, grain prices rise sharply due to local deficits. This degrades the pastoral terms of trade, forcing herders to liquidate multiple animals just to purchase basic grain staples.
Extreme Shock Vulnerability
When acute environmental disasters or disease outbreaks hit, unintegrated households suffer catastrophic asset destruction. Post-flood or drought recovery patterns reveal that over 50% of local pastoral households are forced to restrict their daily food intake, driving families to take on an average of 95,000 FCFA in emergency debt to replace lost stock and survive.
The Biosecurity and Nutrition Trade-off
Even when price dynamics are favorable, poor market infrastructure forces unhygienic live-animal keeping within close proximity to household dwellings. Integrated livestock ownership significantly boosts dietary diversity, with an Odds Ratio of 1.89 for children achieving minimum dietary diversity through direct access to fresh milk.
Yet, because local assembly markets lack sanitary processing zones, 79.5% of local health reports link traditional backyard animal keeping to elevated child diarrheal risks. This exposure causes environmental enteropathy, a gut condition that impairs nutrient absorption, structurally reversing the dietary gains of livestock ownership.
Synthesis: Market Integration Outcomes
| Level of Market Integration | Economic Security | Vulnerability to Shocks | Nutritional & Welfare Status |
|---|---|---|---|
| Highly Integrated (Western Highlands Dairy) | High cash liquidity, formal credit access via tontines (88.31% participation), up to 230,100 FCFA monthly processing profits | Protected from climate shocks; highly vulnerable to feed input price inflation and viral epidemics | High dietary diversity; minimal stunting; elevated zoonotic risk if biosecurity is omitted |
| Marginally Integrated / Isolated (Extensive Northern Transhumance, Remote Small Ruminants) | High exposure to middleman pricing squeeze; live cattle sold based on raw visual weight estimation; cash locked in biological assets | Extreme climate vulnerability; dry-season lean periods trigger animal emaciation and 95,000 FCFA average emergency debt | Vulnerable to structural protein deficits; dependent on physical animal asset liquidation for emergency survival |
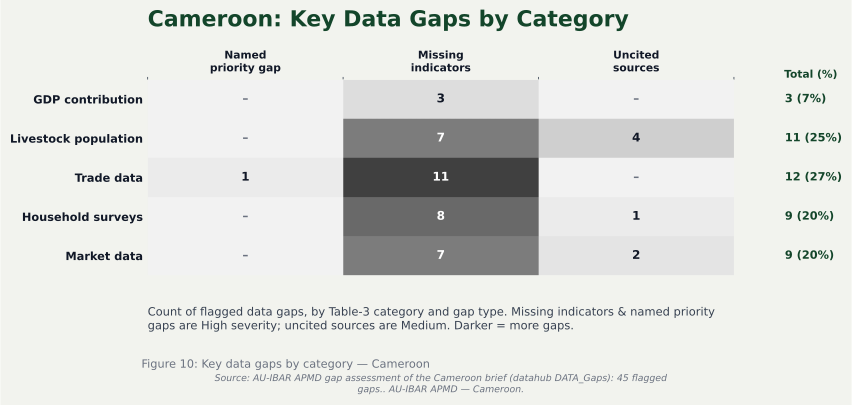
The recognition of pastoralism's socioeconomic contribution to Cameroon's economy is severely hindered by significant tracking gaps. Methodologies rely on outdated surveys and static parameters, which obscure the actual fiscal weight of the sector on official gross domestic product (GDP) dashboards.
| Data Category | Gap Description | Impact on Recognition | Possible Action |
|---|---|---|---|
| GDP Contribution | • Structural blending of "Livestock" and "Hunting" into a single composite accounting branch by the INS | • Masks the standalone commercial performance of pastoral husbandry and industrial animal production. | • Structurally decouple hunting from animal husbandry within the INS national accounting framework to isolate livestock GDP. |
| Livestock Population | • Over-reliance on mathematical extrapolations from historical baseline surveys (2016) rather than regular real-time census data. | • Fails to integrate sudden environmental or macroeconomic shocks, such as localized dry-season disruptions in northern regions. | • Finance and fully implement the planned General Census of Agriculture and Livestock (Recensement Général de l'Agriculture et de l'Élevage - RGAE). |
| Trade Data | • Lack of statistical tracking at the border for fluid, cross-border transhumant migrations between Cameroon, Chad, CAR, and Nigeria | • Millions of animal exchanges occur outside formal corporate supply chains, causing live trade figures to be heavily underestimated. | • Deploy mobile-based digital registries across traditional transhumance corridors and MINEPIA veterinary sanitary checkpoints. |
| Household Surveys | • Low spatial completeness, communication bottlenecks in territorial services, and unmonitored backyard slaughters. | • Erases the domestic safety-net value of smallholder stock from official rural development metrics and vulnerability assessments. | • Update sampling frames using decentralized digital reporting channels to systematically register backyard production metrics. |
| Market Data | • Rigid application of historical conversion multipliers (e.g., carcass weight to offal ratios) and static correction coefficients. | • Operating on the assumption that field under-evaluation remains stable over time degrades the accuracy of modern investment policies. | • Replace decade-old baseline assumptions with real-time, field-verified market transaction logs and updated slaughterhouse metrics. |
6.1 Summary of Findings
The empirical evidence compiled across Cameroon's agro-ecological zones demonstrates that the livestock sector particularly pastoral and extensive ruminant grazing frameworks functions as a resilient, indispensable anchor for the national economy and rural social fabric. In 2024, despite severe climatic and logistical shocks, the "Livestock and Hunting" sub-sector accelerated to a dynamic volume growth rate of 4.8%, generating 730.3 billion FCFA ($1.20 Billion USD) in nominal gross value added. This structural output represents 12.24% of the wider primary economy and directly supports over 30% of the rural population, absorbing massive quantities of labor across traditional and emerging value chains. For millions of smallholders and ancestral communities (such as the ethnic Mbororo and Fulbe herders), livestock serves as an active banking instrument and an emergency safety net, providing critical daily cash flow, intergenerational wealth transference, and organic soil fertilization.
However, the true fiscal weight and socioeconomic value of pastoral systems remain systemically erased from national accounting metrics and policy dashboards due to profound statistical data gaps. The structural blending of hunting and livestock indicators by the INS, an over-reliance on a decade-old baseline survey (2016), and a total absence of digital tracking across fluid transboundary corridors mean that a massive volume of international trade slips past formal veterinary checkpoints. Consequently, pastoral livelihoods face extreme structural vulnerabilities. Unintegrated pastoralists are trapped by an informal middleman monopoly (dilali), escalating land-use conflicts in saturated regions (such as the West and South-West where land utilization exceeds 86%), chronic cattle rustling affecting 70.8% of operators, and severe seasonal lean periods that cause extensive herd emaciation for 1.2 million cattle annually. These vulnerabilities directly jeopardize national food security goals under the Stratégie Nationale de Développement (SND30).
6.2 Specific and Actionable Policy Implications
-
1Implement Institutional National Accounting Reforms to Isolate Livestock GDP — Target Audience: National Institute of Statistics (INS) and Ministry of Livestock, Fisheries and Animal Industries. Actionable Strategy: Formally disaggregate the "Livestock and Hunting" branch within the national accounting matrix. The INS must establish a standalone accounting branch for animal production to eliminate the analytical distortion that currently masks the commercial performance of pastoral husbandry. This reform is a prerequisites for unlocking proportionate public infrastructure budgeting under the SND30 framework.
-
2Execute the Planned General Census of Agriculture and Livestock (RGAE) — Target Audience: Ministry of Economy, Planning, and Regional Development (MINEPAT) and MINEPIA. Actionable Strategy: Fully finance and mobilize field operations for the long-delayed Recensement Général de l'Agriculture et de l'Élevage (RGAE). National planning must immediately replace rigid mathematical extrapolations and static carcass conversion multipliers derived from the outdated 2016 baseline survey. Collecting real-time field data will bridge the gap between formal macroeconomics and the rural economy, integrating sudden environmental shocks into national policy models.
-
3Modernize Border Posts and Trade Corridors via Mobile-Based Digital Registries — Target Audience: MINEPIA Customs, Territorial Administration, and CEMAC Regional Bodies. Actionable Strategy: Deploy mobile-based digital registry networks across traditional transhumance corridors and MINEPIA-monitored veterinary sanitary checkpoints (Postes d'Inspection Sanitaire Vétérinaire), particularly active transit hubs like Ekombitié. Moving away from fragmented manual logs will capture the millions of live animal exchanges that cross borders informally between Chad, CAR, Nigeria, and Cameroon, officially recording livestock's immense contribution to foreign exchange reserves.
-
4Mitigate Agro-Pastoral Conflicts through Gazetted Land-Use Planning — Target Audience: MINEPAT, MINADER, and Local Municipal Authorities. Actionable Strategy: Enforce strict spatial planning and secure legal protections for traditional grazing corridors, particularly in highly saturated zones like the West (86.1% land utilization) and South-West (88.1% land utilization) regions where crop-pastoral conflicts disrupt production for 81.1% of herders. Delineating permanent pasture zones and cattle tracks will protect biological capital from localized clashes and asset insecurity.
-
5Pair Livestock Productivity Programs with Biosecurity and Sanitation Training — Target Audience: MINEPIA Regional Delegations and Ministry of Public Health. Actionable Strategy: Expand decentralized animal healthcare infrastructure beyond the current 160 veterinary facilities to reach isolated zones where 87.5% of family holdings have never received a state veterinary visit. Crucially, extension services must pair livestock distribution programs with strict biosecurity and sanitary training; traditional, unhygienic backyard livestock keeping is currently linked to 79.5% of child diarrheal reports, inducing environmental enteropathy that structurally reverses the nutritional gains of milk consumption.
- Bureau Central des Recensements et des Études de Population (BUCREP) (2025). Demographic Structural Surveys: Estimation of Sector Populations Across Major Cattle-Producing Agroecological Zones. BUCREP, République du Cameroun. URL: https://bucrep.org
- Famine Early Warning Systems Network (FEWS NET) (2019). Livelihood Zone Map and Descriptions for Cameroon. Technical Report supported by USAID and MINADER. FEWS NET / USAID. https://fews.net/sites/default/files/documents/reports/Cameroon%20LH_Zoning_Report_201911_Final.pdf
- Gouvernement du Cameroun / Services du Premier Ministre (2020). Stratégie Nationale de Développement 2020-2030 (SND30): Pour la transformation structurelle et le développement inclusif. Services du Premier Ministre, République du Cameroun. https://minepat.gov.cm/wp-content/uploads/2022/01/NDS30_National-Development-Strategy-2020-2030.pdf
- Institut National de la Statistique (INS) Cameroun (2025). Les Comptes Nationaux de 2024. Département des Synthèses Économiques, Institut National de la Statistique, République du Cameroun. https://inscameroun.cm/wpcontent/uploads/2025/09/Comptes_Nationaux_2024_Final_FR.pdf
- International Fund for Agricultural Development (IFAD) (2016). How to do: Livestock value chain analysis and project development: Sustainable inclusion of smallholders in agricultural value chains. Policy and Technical Advisory Division, IFAD. https://www.ifad.org/documents/38714170/40262483/Livestock+value+chain+analysis+and+project+development.pdf
- Ministère de l'Agriculture et du Développement Rural (MINADER) (2020). Stratégie de Développement du Secteur Rural (SDSR) - Synthèse du volet Agriculture et Développement Rural. MINADER, République du Cameroun. https://gpe-cameroun.cm/wp-content/uploads/2025/02/SDSR-PNIA-2020-2030_Francais.pdf
- Ministry of Economy, Planning, and Regional Development (MINEPAT), Republic of Cameroon (2022). Atlas de Développement Physique du Cameroun (Version Définitive). Société Tunisienne d'Informatique pour l'Ingénierie (ST2I) / MINEPAT.
- MINEPAT / STUDI International (2017). Élaboration du Schéma National d'Aménagement et de Développement Durable du Territoire du Cameroun (SNADDT) - Rapport de Diagnostic: Recueil Cartographique. MINEPAT, République du Cameroun.
- Ministry of Livestock, Fisheries and Animal Industries (MINEPIA) (2012). Enquête sur la productivité des cheptels bovins, ovins et caprins au Cameroun: Final Report. Division of Statistical Studies and Cooperation (DESC), MINEPIA, Republic of Cameroon. https://ins-cameroun.cm/wp-content/uploads/2025/06/ANNUAIRE-STATISTIQUE-MINEPIA_07-06-22.pdf
- Ministry of Livestock, Fisheries and Animal Industries (MINEPIA) (2023). Annuaire Statistique du Sous-Secteur de l'Élevage, des Pêches et des Industries Animales, Édition 2021. MINEPIA, République du Cameroun.
- Ministry of Livestock, Fisheries and Animal Industries (MINEPIA) (2024a). Situation de la Production et des Importations du Sous-Secteur Élevage, Pêches et Industries Animales: Année 2023. Division des Études, de la Planification, de la Coopération et des Statistiques, MINEPIA, République du Cameroun. https://minepia.cm/site/wp-content/uploads/2024/11/Situation-de-la-production-et-des-importations-du-sous-secteur-EPIA-2023.pdf
- Ministry of Livestock, Fisheries and Animal Industries (MINEPIA) (2024b). Production and Imports in the Livestock, Fishery and Animal Industry Sub-Sector: Year 2023. Department of Studies, Planning, Cooperation and Statistics, MINEPIA, Republic of Cameroon. URL: https://minepia.cm/site/wp-content/uploads/2024/11/PRODUCTION-AND-IMPORTS-IN-THE-LIVESTOCK-FISHERY-AND-ANIMAL-INDUSTRY-SUB-SECTOR_2023.pdf
- Motta, P., Porphyre, T., Handel, I. G., Hamman, S. M., Ngu Ngwa, V., Tanya, V. N., Morgan, K. L., & Bronsvoort, B. M. deC. (2019). Characterizing Livestock Markets, Primary Diseases, and Key Management Practices Along the Livestock Supply Chain in Cameroon. Frontiers in Veterinary Science, 6:101. URL: https://www.researchgate.net/publication/332323491_Characterizing_Livestock_Markets_Primary_Diseases_and_Key_Management_Practices_Along_the_Livestock_Supply_Chain_in_Cameroon
- Njong, A. M. (2011). Climate change and livestock farming in Cameroon: Impacts and implications for poverty reduction. International Journal of Current Research, 3(3), 115-126. https://journalcra.com/sites/default/files/issue-pdf/436.pdf
- Pamo, Etienne Tedonkeng (2008). Country Pasture/Forage Resource Profiles: Cameroon. Food and Agriculture Organization of the United Nations (FAO). https://fr.scribd.com/document/346401802/FAO-forage-profile-Cameroon-pdf
- Value Chain Data Records (2024). Production metrics, household survey statistics, and sector constraints in regional livestock operations. Technical Working Database on Agropastoral Value Chains and Sector Diagnostics. https://www.ifad.org/documents/48415603/51143611/cameroon-aep-report.pdf/b755311c-f92c-1407-00c0-12bbe9b1ef7e?t=1752747342289
- World Bank Group (2025). Cameroon Country Overview & Economic Updates: Strengthening Agropastoral Resilience. Washington, D.C.: The World Bank. https://documents1.worldbank.org/curated/en/099071425092552956/pdf/P181230-db05a052-803c-4251-82ef-fefe79488149.pdf
| Metric | 2023 Value | 2024 Value | Change / Trend | Source |
|---|---|---|---|---|
| Nominal GDP (FCFA) | 29,609.4 billion | 32,316.2 billion | +2,706.8 billion | INS Report |
| Nominal GDP (USD) | ~$48.8 billion | $53.3 billion | +$4.5 billion | World Bank Data |
| Real GDP (Chained FCFA) | 24,790.6 billion | 25,664.4 billion | +873.8 billion | INS Report |
| Real GDP Growth Rate | 3.3% | 3.5% | +0.2 percentage points | INS Report |
| National Inflation | 7.4% | 4.5% | -2.9 percentage points | INS Report |
| Species | 2016 | 2017 | 2018 | 2019 | 2020 | 2021 | 2022 | 2023 |
|---|---|---|---|---|---|---|---|---|
| Cattle | 7,456,123 | 7,890,962 | 8,761,385 | 9,506,103 | 9,857,361 | 10,202,369 | 10,559,452 | 10,929,032 |
| Sheep | 3,283,086 | 3,345,340 | 3,499,933 | 3,604,931 | 3,817,395 | 3,931,917 | 4,049,874 | 4,171,371 |
| Goats | 6,365,528 | 6,441,915 | 6,506,334 | 6,571,397 | 7,078,226 | 7,149,008 | 7,220,498 | 7,292,703 |